

Ok, so how many records did I break?


Ok, so how many records did I break?
Crunch with us, the XS WCG team
The XS WCG team needs your support.
A good project with good goals.
Come join us,get that warm fuzzy feeling that you've done something good for mankind.
Originally Posted by Frisch

First, fix the screenie for your 32M run.
I'd like to see what the 32M SuperPi record of 6 and half minutes on LN2 turns into...
Otherwise every single run except for the 1M run is a new record.
On that note:
For the SuperPi-sized records on the download page, you should be able to clean-sweep everything from 2M all the way to 1G with 6GB of ram.
The 1M time of .405 seconds is hard to beat without OCing because it's too small of a computation to get much benefit from multi-threading.
Main Machine:
AMD FX8350 @ stock --- 16 GB DDR3 @ 1333 MHz --- Asus M5A99FX Pro R2.0 --- 2.0 TB Seagate
Miscellaneous Workstations for Code-Testing:
Intel Core i7 4770K @ 4.0 GHz --- 32 GB DDR3 @ 1866 MHz --- Asus Z87-Plus --- 1.5 TB (boot) --- 4 x 1 TB + 4 x 2 TB (swap)
Last edited by El Greco; 07-21-2009 at 12:06 PM.
"friends don't let friends run RAID-0"
This better?
What? No updates yet? It's been 5 mins!
http://www.numberworld.org/y-cruncher/#Benchmarks
Last edited by Movieman; 07-21-2009 at 12:13 PM.
Crunch with us, the XS WCG team
The XS WCG team needs your support.
A good project with good goals.
Come join us,get that warm fuzzy feeling that you've done something good for mankind.
"friends don't let friends run RAID-0"
I'll do it tonight. I don't have access to my webserver right now.
Interesting, your 32M time (9.45s) is slower than the W5580s (9.30s)... even though your memory is probably faster. Seems like that person did some serious tweaking.
You might have to do the same to beat those numbers. But for something larger like 256M, 512M, or 1G, your clock and memory speed advantage should beat any tweak.
For something as small as 32M, there's a lot of thread-creation/destruction overhead. So you might want disable HT or use the Custom Compute mode to override the thread settings to use fewer threads. At these sizes, the program probably spends a significant amount of time creating and destroying threads... bleh... Then I again, I never optimized the program for small computations.
Another possible reason is that since your memory is faster, your timings are more relaxed. I found that Nehalems have more memory bandwidth than the program needs. So tighter timings and slower memory might be better.
@ El Greco
I think we have a winner here! The first person to show up with a non-power-of-two cores!
You didn't unlock the 4th right?
Last edited by poke349; 07-21-2009 at 12:43 PM.
Main Machine:
AMD FX8350 @ stock --- 16 GB DDR3 @ 1333 MHz --- Asus M5A99FX Pro R2.0 --- 2.0 TB Seagate
Miscellaneous Workstations for Code-Testing:
Intel Core i7 4770K @ 4.0 GHz --- 32 GB DDR3 @ 1866 MHz --- Asus Z87-Plus --- 1.5 TB (boot) --- 4 x 1 TB + 4 x 2 TB (swap)


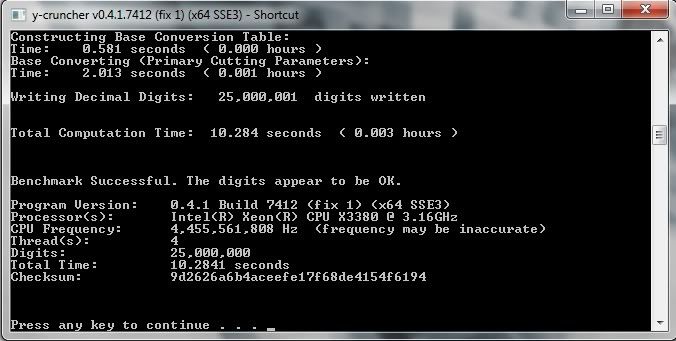
Here's a 25m and 50m
25m on the left, 50m on the right.
100m (no cpu-z in this one)
100m is weird. I've run it about 5 times so far, and, i've had about 4 failures and 1 pass. apparently i'm just on the edge for that test as far as being stable.
1m then 32m
edit2: and yes, dave is defeated in 1m @ least
take that old man
Last edited by ex2cib; 07-21-2009 at 01:13 PM.
System:
2600K / 8GB Corsair Vengeance PC15000
Asus Sabertooth P67 / MSI Twin Frozr II 6950 Crossfire
corsair 1000hx / Corsair 800D obsidian
Crucial M4 128GB SSD / Windows 7 Pro
Cooling:
Koolance 360 rev 1.1 CPU block / MCR320 QP rad
OCZ hydropulse 800 pump w/ EK-DCP 4.0 res
Primochill LRT Black tubing 3/8" ID x 5/8" OD
No..I am still testing the CPU as a X3 to find out the maximum stable OC using the multi only... (17.5 * 200 = 3500) ..you know , so the Black Edition title erns the money i spend for it
"friends don't let friends run RAID-0"
Updated the list (on the first post of this thread) with some of the SuperPi-sized benchmarks.
I also "think" I've fixed "Sanity Check Error" for the smaller SuperPi-sized benchmarks.
Main Machine:
AMD FX8350 @ stock --- 16 GB DDR3 @ 1333 MHz --- Asus M5A99FX Pro R2.0 --- 2.0 TB Seagate
Miscellaneous Workstations for Code-Testing:
Intel Core i7 4770K @ 4.0 GHz --- 32 GB DDR3 @ 1866 MHz --- Asus Z87-Plus --- 1.5 TB (boot) --- 4 x 1 TB + 4 x 2 TB (swap)
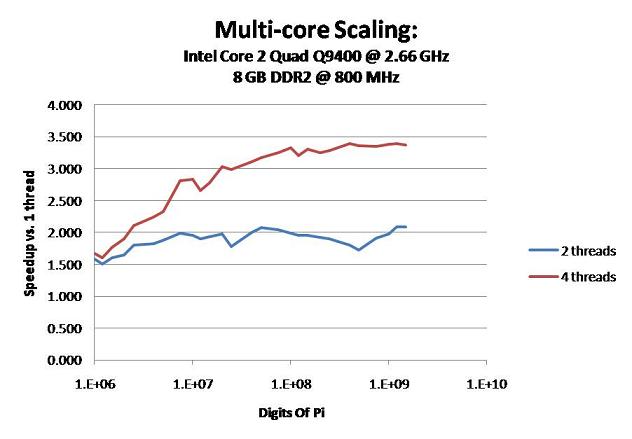
Here's a little something interesting...
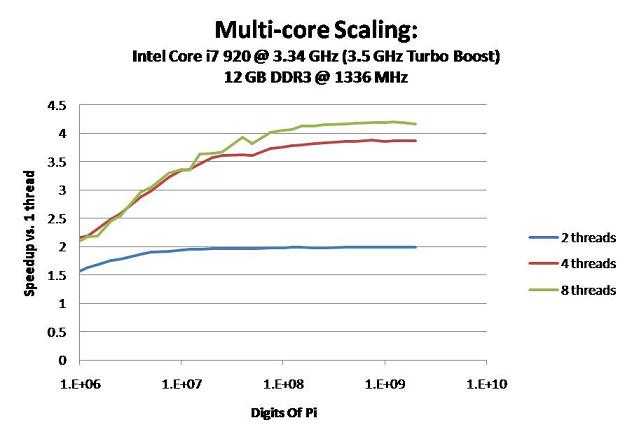
I ran some automated benchmarks on my Lan-Box to see how the new version scales with multiple cores.
Here are the results: Main Page
The graph shows how many times faster a multi-threaded run is than a single-threaded run.
Obviously, 2 threads cannot do any better than 2x improvement and 4 threads cannot do better than 4x.
When the computation is small, the amount of time spawning threads dominates actual computation time. Therefore it scales very poorly for small computations. The bigger you go, the better it scales.
Notice that below ~5 million digits, Hyper-Threading with 8 threads is slower than 4 threads without HT. This is because the benefits of HT is outweighed by the overhead of spawning double the threads.
So if you have an i7 and you want to get the fastest 1M, 2M, or 4M times, try disabling HT...
This wasn't the case in the older versions. Because of a number of optimizations and bug-fixes, v0.4.1 doesn't scale as well as the older versions for small computations. (But it scales slightly better for large computations.)
Last edited by poke349; 07-24-2009 at 01:22 PM.
Main Machine:
AMD FX8350 @ stock --- 16 GB DDR3 @ 1333 MHz --- Asus M5A99FX Pro R2.0 --- 2.0 TB Seagate
Miscellaneous Workstations for Code-Testing:
Intel Core i7 4770K @ 4.0 GHz --- 32 GB DDR3 @ 1866 MHz --- Asus Z87-Plus --- 1.5 TB (boot) --- 4 x 1 TB + 4 x 2 TB (swap)
interesting results with SMT on i7. i think its hilarious your program can calculate 10 trillion digits of pi. is it stable after using more than 46 gigs?
That's 10 billion. Trillion has another set of zeros... (I lose count around that point too...)
Yes, the program is 64-bit. So it has no trouble using as much memory as it wants. As for the computer, it isn't even OC'ed so yes, its perfectly stable with 64GB no problems.
I know of one person who benched this program with 128GB of ram... (namely dual Xeon X5470 with 16 x 8GB DDR2 FB-DIMM)
The program will do a LOT more than just 10 billion.
The current version allows up to 200 billion digits. Though it's only been tested up to 31 billion.
As for what the "true" limit of the program is... I actually have no idea...
I don't see any major "wall" in the implementation until at least 10^16 digits...
But no computer in the world will have the ram or the computational power to test it - not even Road Runner.
Main Machine:
AMD FX8350 @ stock --- 16 GB DDR3 @ 1333 MHz --- Asus M5A99FX Pro R2.0 --- 2.0 TB Seagate
Miscellaneous Workstations for Code-Testing:
Intel Core i7 4770K @ 4.0 GHz --- 32 GB DDR3 @ 1866 MHz --- Asus Z87-Plus --- 1.5 TB (boot) --- 4 x 1 TB + 4 x 2 TB (swap)


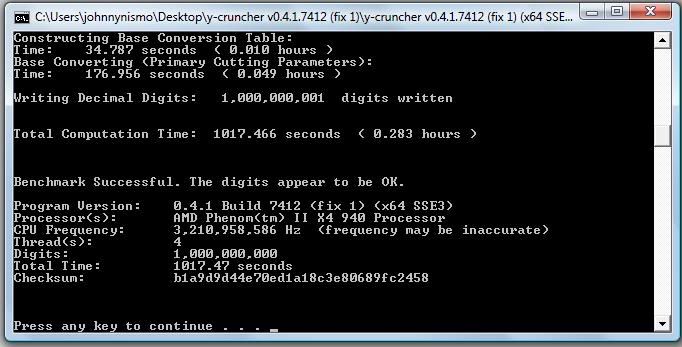
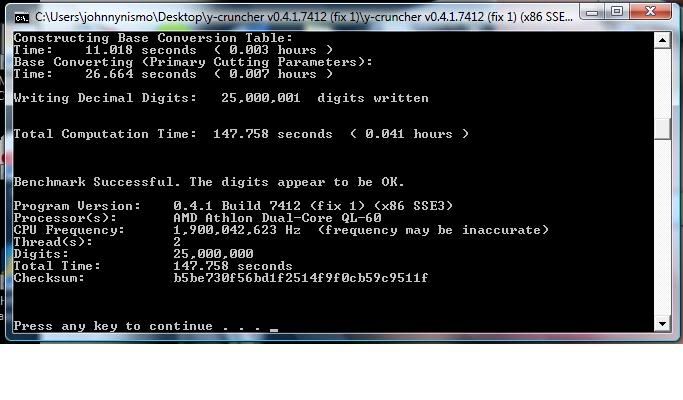
My Phenom II wants on the list right ahead of those two Q6600s@3.2GhzProgram Version: 0.4.1 Build 7412 (fix 1) (x64 SSE3)
Processor(s): AMD Phenom(tm) II X4 940 Processor
CPU Frequency: 3210978905
Thread(s): 2^2
Digits: 25000000
Total Time: 15.455
Checksum: 006b916ff8c0d1b40b57fc77474331ca.
Core i7 2600K@4.6Ghz| 16GB G.Skill@2133Mhz 9-11-10-28-38 1.65v| ASUS P8Z77-V PRO | Corsair 750i PSU | ASUS GTX 980 OC | Xonar DSX | Samsung 840 Pro 128GB |A bunch of HDDs and terabytes | Oculus Rift w/ touch | ASUS 24" 144Hz G-sync monitor
My laptop is utterly WEAKSAUCE! I need a Phenom II X4 laptop (If you ask why, you're not xtreme).
Core i7 2600K@4.6Ghz| 16GB G.Skill@2133Mhz 9-11-10-28-38 1.65v| ASUS P8Z77-V PRO | Corsair 750i PSU | ASUS GTX 980 OC | Xonar DSX | Samsung 840 Pro 128GB |A bunch of HDDs and terabytes | Oculus Rift w/ touch | ASUS 24" 144Hz G-sync monitor
For this run I had to clock my memory to 800mhz as I'm running 4-Dimms of mismatched RAM. One set of Corsair Dominators and one set of OCZ Reapers. I haven't figured out timings that allow all four to work at 1066mhz yet. I suppose it's still not a bad score.
Core i7 2600K@4.6Ghz| 16GB G.Skill@2133Mhz 9-11-10-28-38 1.65v| ASUS P8Z77-V PRO | Corsair 750i PSU | ASUS GTX 980 OC | Xonar DSX | Samsung 840 Pro 128GB |A bunch of HDDs and terabytes | Oculus Rift w/ touch | ASUS 24" 144Hz G-sync monitor
Yeah, I'm surprised at how evenly Phenom II and Core 2 Quad are matched. The program was written and tuned on two machines: Pentium D and Harpertown (the only two I had at the time). So I'd expect Intels to run faster. But obviously that isn't really the case.
C2Q is still a tiny bit faster though, but not by much. (Your run is a bit faster because of the newer version.)
Mine isn't much better... 1.6 GHz Core Duo...
Mismatched? What were you running before?
EDIT: Nevermind, I see it in your siggy. I suppose you could try some really conservative timings to see what happens...
And no, it isn't a bad score... The fact that you have enough ram to do 1b automatically makes it a good score...
EDIT: There isn't really such thing as a good or bad score... since the range of hardware on that list is massive... (From Atom to Gainestown...) So it's only fair to compare with hardware similar to yours.
Last edited by poke349; 07-26-2009 at 03:51 PM.
Main Machine:
AMD FX8350 @ stock --- 16 GB DDR3 @ 1333 MHz --- Asus M5A99FX Pro R2.0 --- 2.0 TB Seagate
Miscellaneous Workstations for Code-Testing:
Intel Core i7 4770K @ 4.0 GHz --- 32 GB DDR3 @ 1866 MHz --- Asus Z87-Plus --- 1.5 TB (boot) --- 4 x 1 TB + 4 x 2 TB (swap)
That new version is alot faster, same setup as before.
Q9650
2600k
this has to do with bottlenecks in the cpu. AMD has very fast execution units but slow retirement units and performs well under full load. the predecoding in core 2 limits performance in cpu intensive programs.
I was thinking the exact opposite. Core 2 has better SSE throughput than K10, but Core 2 is limited by memory bandwidth.
Now for a quick disclaimer on yet-another "sensitive" issue of Intel vs. AMD:
Before anybody yells at me for drawing a conclusion that Intel has faster arithmetic than AMD, this is merely my guesstimate based on the benchmarks. In no way does it indicate that Intel or AMD is better.
Since the vast majority of the program was written and tuned on Pentium and Harpertown (which is a Core 2), I'd expect there so be some favoring towards Intel.
As for the memory bandwidth issue, I've noticed that the program scales pretty poorly on Core 2 Quads... But, the only ones I've played with is Q6600 and Q9400 - both of which have significantly smaller cache than Harpertown.
If we to want throw out the bandwidth factor to determine which (Core 2 or K10) has better arithmetic throughput for this program, we'll need to do a single-threaded benchmark comparison between a Core 2 and a K10 at the same frequency.
My guess is that Core 2 will win (simply because I tuned for it), but I unfortunately don't have access to any K10s to try it.
Anyone have both and care enough to try that?
Last edited by poke349; 07-26-2009 at 09:02 PM. Reason: typo
Main Machine:
AMD FX8350 @ stock --- 16 GB DDR3 @ 1333 MHz --- Asus M5A99FX Pro R2.0 --- 2.0 TB Seagate
Miscellaneous Workstations for Code-Testing:
Intel Core i7 4770K @ 4.0 GHz --- 32 GB DDR3 @ 1866 MHz --- Asus Z87-Plus --- 1.5 TB (boot) --- 4 x 1 TB + 4 x 2 TB (swap)
Don't worry about saying one performs better than the other. The truth is both AMD and Intel uarchs have their strengths and weaknesses. If they were both good and bad at the same tasks and performed exactly the same it would make for a pretty boring conversation. Differences are good for this reason.
@Poke and Chumbucket: You two come to different conclusions as to where the performance and bottlenecks are on each platform. I suggest that you may both be correct. AMD has a great HyperTransport platform to work with, and needs to be pused at full load to shine. Core 2 gets choked up under load because of Chumbuckets' explanation and FSB bandwidth anemia.
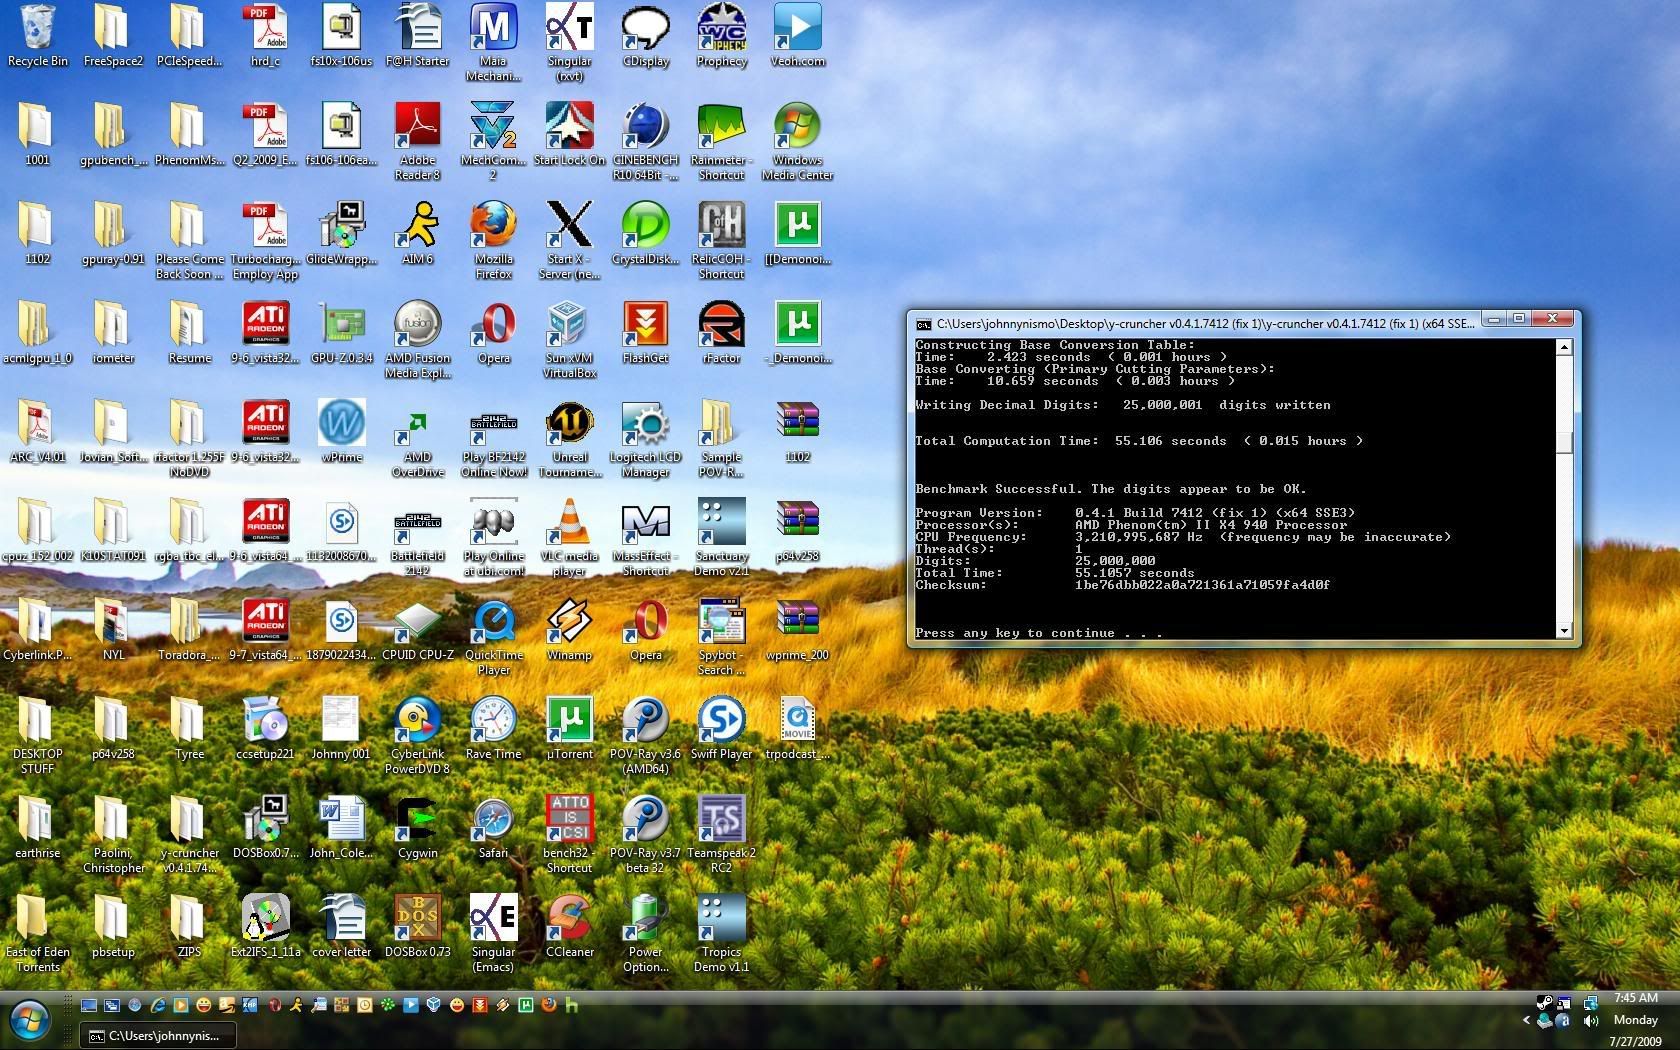
PS: Dropping my memory from 1066 to 800 only increased my 25M score by less than 0.3 seconds. Not as bad of a hit as I was expecting.
EDIT: Single Threaded Phenom II 25M Test
Last edited by Mechromancer; 07-27-2009 at 04:48 AM.
Core i7 2600K@4.6Ghz| 16GB G.Skill@2133Mhz 9-11-10-28-38 1.65v| ASUS P8Z77-V PRO | Corsair 750i PSU | ASUS GTX 980 OC | Xonar DSX | Samsung 840 Pro 128GB |A bunch of HDDs and terabytes | Oculus Rift w/ touch | ASUS 24" 144Hz G-sync monitor
But then... I'm comparing Core 2 and K10. I've completely left Core i7 out of the equation.
Anyways...
Anyone got a Core 2 @ 3.2 GHz? My workstation is, but it's down and it's not coming back online for a few more weeks.
.3 seconds ~ 2%. That isn't much. Going from triple to dual channel @ 1600 MHz on my friend's i7 only made about 2% difference @ 100m... (the larger you go, the bigger the impact of memory bandwidth)
I know on dual-Harpertown, the difference between 667MHz and 800 MHz is huge - like 10% @ 500m... and it gets bigger and bigger as you scale up the size.
My rig,
Dual Xeon X5482 @ 3.2 GHz + 64 GB (16 x 4GB) @ 800 MHz
beats,
Dual Xeon X5470 @ 3.33 GHz + 128 GB (16 x 8GB) @ 667 MHz
by around 5 - 10% at 250m - 1b.
These aren't your normal desktops, so ignore the sheer quantity of ram.It's the speed that matters.
There's probably a threshold somewhere where extra bandwidth isn't going to help much. Though I haven't bothered to try to find it.
P.S.
Toradora = WIN!!!!! (sorry for looking at your desktop icons)
Last edited by poke349; 07-27-2009 at 02:27 PM.
Main Machine:
AMD FX8350 @ stock --- 16 GB DDR3 @ 1333 MHz --- Asus M5A99FX Pro R2.0 --- 2.0 TB Seagate
Miscellaneous Workstations for Code-Testing:
Intel Core i7 4770K @ 4.0 GHz --- 32 GB DDR3 @ 1866 MHz --- Asus Z87-Plus --- 1.5 TB (boot) --- 4 x 1 TB + 4 x 2 TB (swap)
Yes, I like me some manga and anime. I have no prob with anybody looking at my icons. If I did, I would have edited it out like the rest of you pr0n addicts. Ok jk, I really just wanted everybody to see how leet I am for having old games like Wing Commander Prophecy, Freespace 2, and Lock On which I still play with my Suncom F-15 E Talon+SFS Throttle HOTAS.
Also, I'm JohnnyNismo from www.Houston240sx.com if anyone cares. My drift b***h is once again my daily driver so no fun for me anymore.
Core i7 2600K@4.6Ghz| 16GB G.Skill@2133Mhz 9-11-10-28-38 1.65v| ASUS P8Z77-V PRO | Corsair 750i PSU | ASUS GTX 980 OC | Xonar DSX | Samsung 840 Pro 128GB |A bunch of HDDs and terabytes | Oculus Rift w/ touch | ASUS 24" 144Hz G-sync monitor
here a core 2 quad at stock. One of the reasons for poor scaling is core 2's cache. it has no shared l3 so the cores only get 2mb l2 each.

Those were done using processor affinity right? Because there's no 3-thread mode, and 2-thread mode will use up to 4 threads.
Also I think a big reason is that the program was tuned with 3MB of cache per thread. So massive cache spilling on a bandwidth-limited system will have major penalties.
Here's Q9400 scaling... Also very bad. I also don't know what was causing all of the variation in the benchmarks.
Main Page
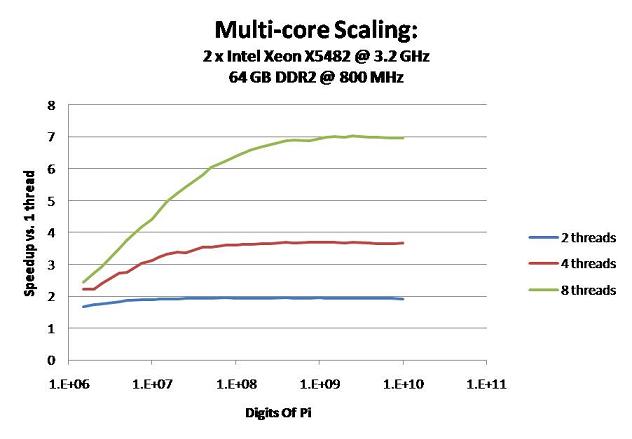
Here's some very old results with version 0.2.1 on my workstation:
Scaling seems to hit a wall at 7x. I'm almost certain it's the memory bandwidth.
Main Page
I need to integrate a bulk-bench option that will generate the data for these graphs without having to do each benchmark by hand.
I already have an automated benchmark add-on (hence how I did all these runs), but it has no interface yet - all options are set in the source code and I have to recompile it everytime I change a setting.
Main Machine:
AMD FX8350 @ stock --- 16 GB DDR3 @ 1333 MHz --- Asus M5A99FX Pro R2.0 --- 2.0 TB Seagate
Miscellaneous Workstations for Code-Testing:
Intel Core i7 4770K @ 4.0 GHz --- 32 GB DDR3 @ 1866 MHz --- Asus Z87-Plus --- 1.5 TB (boot) --- 4 x 1 TB + 4 x 2 TB (swap)
i turned off the cores in msconfig so no background tasks would be placed on other cores. i noticed there was no 3 thread mode b/c when i had 3 threads it said i had 4. i will have a speed up graph soon but i am a newb at openoffice.
 Posting Permissions


 Reply With Quote


Bookmarks