


Hello-
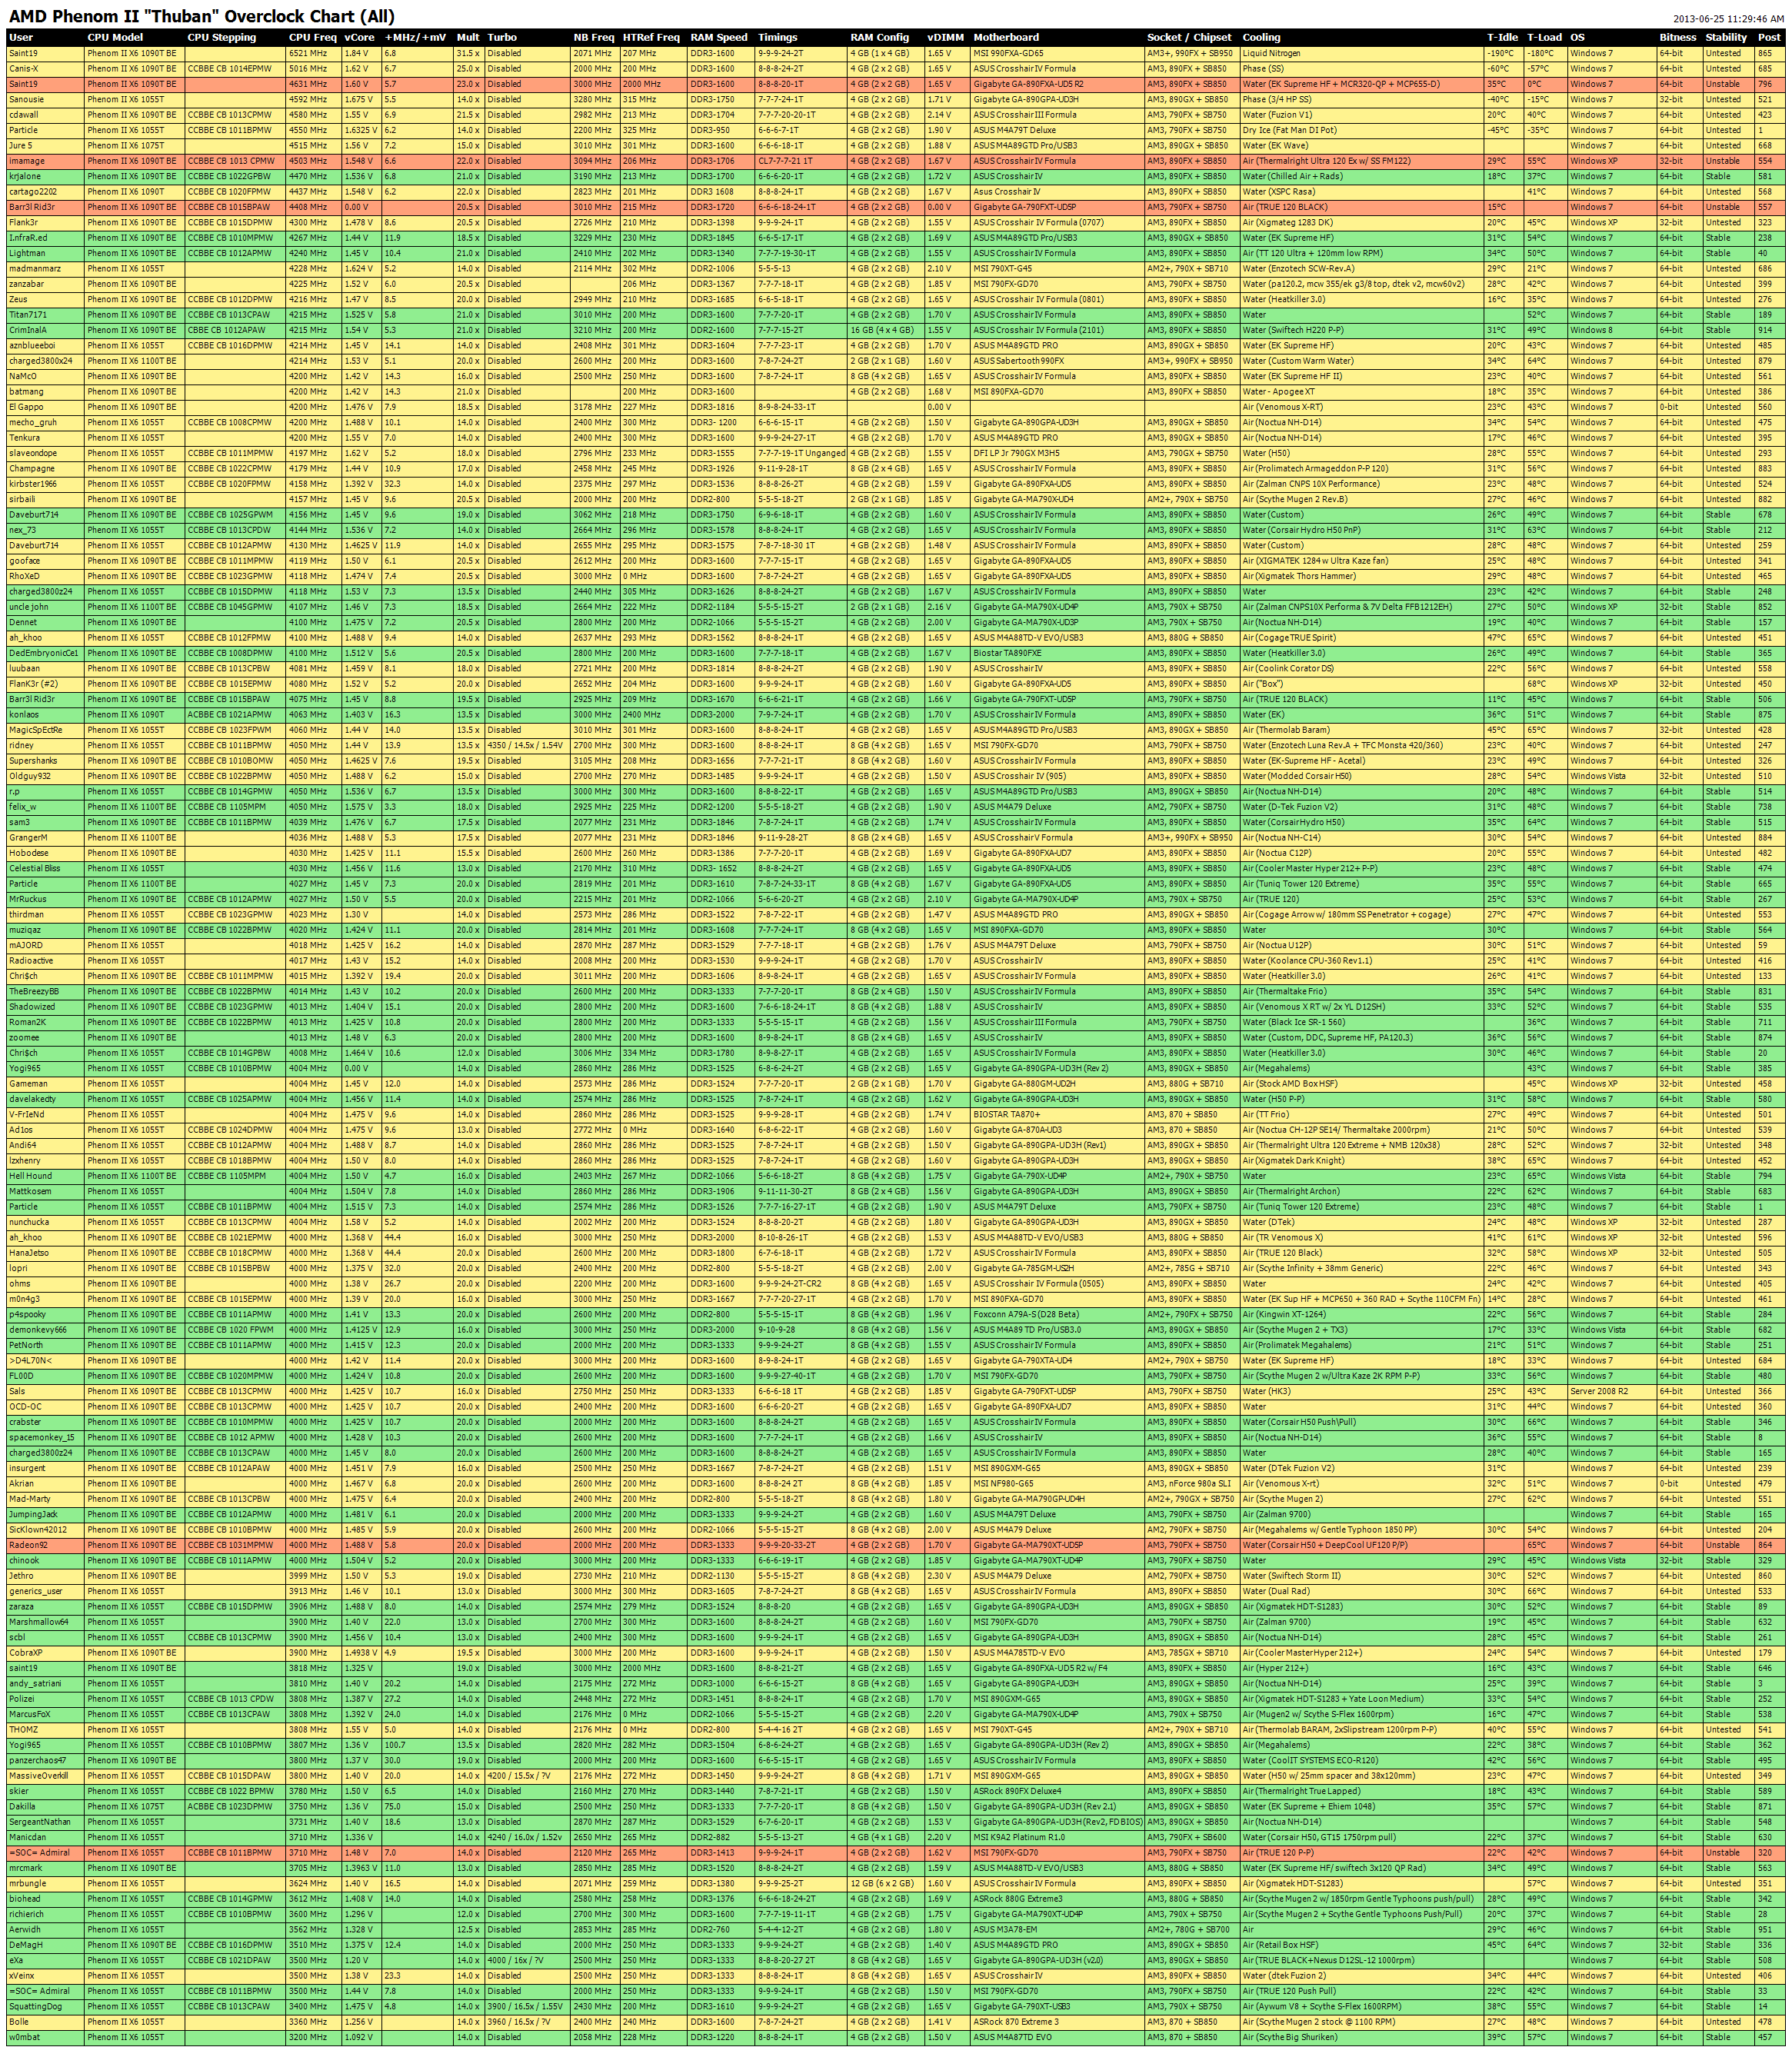
It is my intention to start an overclocking chart for the new AMD Thuban core CPUs for members of XS.
Please read this information carefully before submitting your entry!
If you want on the chart, please post the following information here and then PM me the post number.
Here is an example. Please copy and paste this form, as my program needs it formatted in such a way to import your data. ALSO, please specify when posting if you are updating a previous entry (and specify which one) or adding a new one. It is conceivable that people may have more than one of these, so I don't want to assume your intentions.
- CPU Model: AMD Phenom II X6 1090T BE
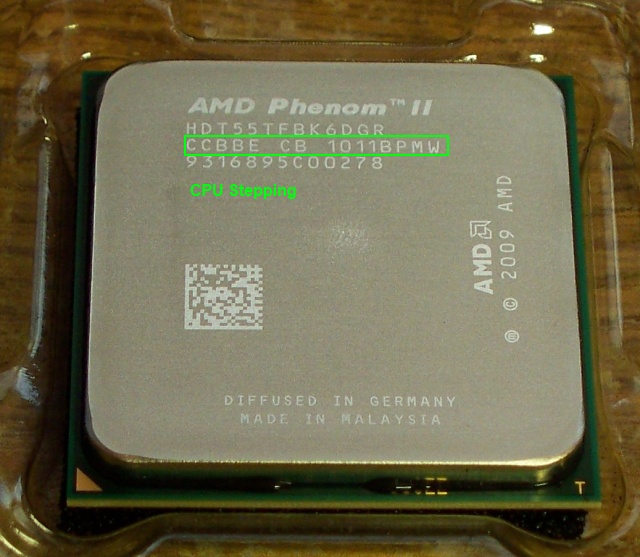
- CPU Stepping: CCBBE CB 1011BPMW
- CPU Frequency: 4000 MHz
- CPU vCore: 1.475V
- CPU Multiplier: 14x
- CPU Turbo: Disabled
- CPU NB Speed: 2200 MHz
- HT Ref Speed: 200 MHz
- RAM Speed: DDR3-1333
- RAM Timings: 7-7-7-24-2T
- RAM Configuration: 4 GB (2 x 2 GB)
- RAM vDIMM: 1.65V
- Motherboard: ASUS M4A79T Deluxe
- Chipset/Socket: AM3, 790FX + SB750
- Cooling: Air (Freezer 7 Pro)
- Temps: 40C Idle / 65C Load
- Operating System: Windows 7
- 32/64-Bit: 64
- Stable/Suicide/Untested: Untested
Stable = Tested stable for 8+ hours as defined below.
Untested = Has not crashed or shown signs of instability but no formal testing has been done. May or may not be fully stable.
Unstable = Has shown signs of instability. It has BSOD'd, crashed, restarted, mis-calculated results, errored during WCG, is acting funny, etc.
Stable, for the purposes of this chart, is defined as a minimum of 8 hours of OCCT, Intel Burn Test, LinX, y-cruncher in stress test mode*, or Prime95. Prime set to blend or OCCT set to medium data set are currently the preference since it tests both the cores and memory systems simultaneously. You must have a screen shot of this in order to be added to the chart as stable as of May 1, 2010.
* Launch the program, press 2, enter, 0, enter, x GB (x being nearly how much RAM your system has free according to task manager), and press enter. The program will periodically indicate how much time has been consumed for the testing.
Load voltage is best reported as your actual voltage, not your VID (what is set in BIOS) if available. Many motherboards droop or overvolt versus the specified VID when under a load, and that can be a significant change. A multimeter is best, but integrated sensors are better than nothing. Report just your highest vCore be it under load, BIOS, or idle instead of your average.
Temperatures are best reported as your CPU temperature instead of core temp. Core temps aren't reading properly with these new chips yet. Programs don't seem calibrated for their values quite yet and will report temps -10 to -20C versus actual core temp.
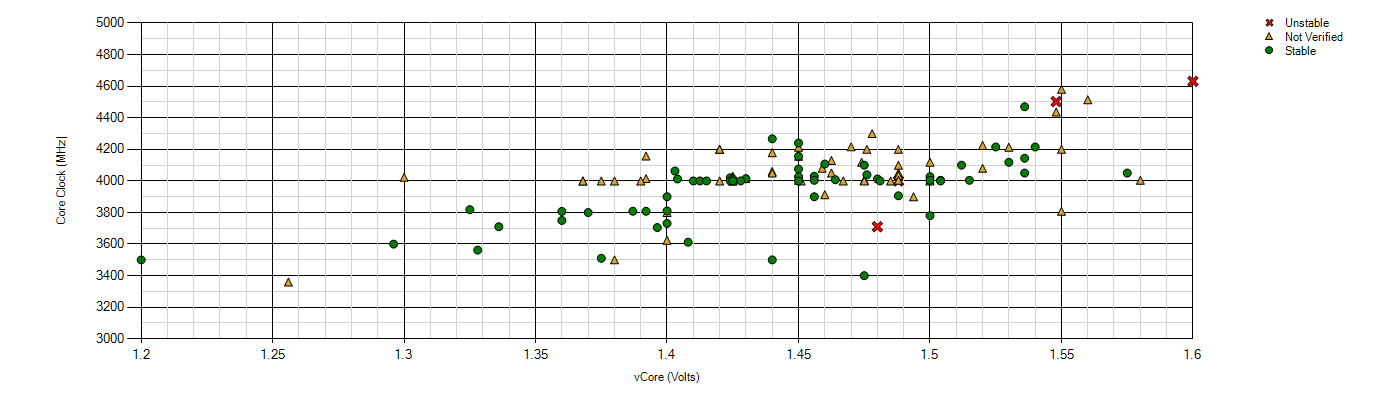
The quick version for what to expect (stable) from an average Thuban CPU:
On Air: 3900-4100 MHz is typical. 4000 MHz even is very common.
On Water: 4000-4250 MHz is typical. 4100 is probably reasonable, but ymmv.
Cold (SS Phase, Chilled, etc): 4300-4500 MHz. We don't have a lot of samples of CPUs having been stress tested under cold, so this is as much guess as observation.
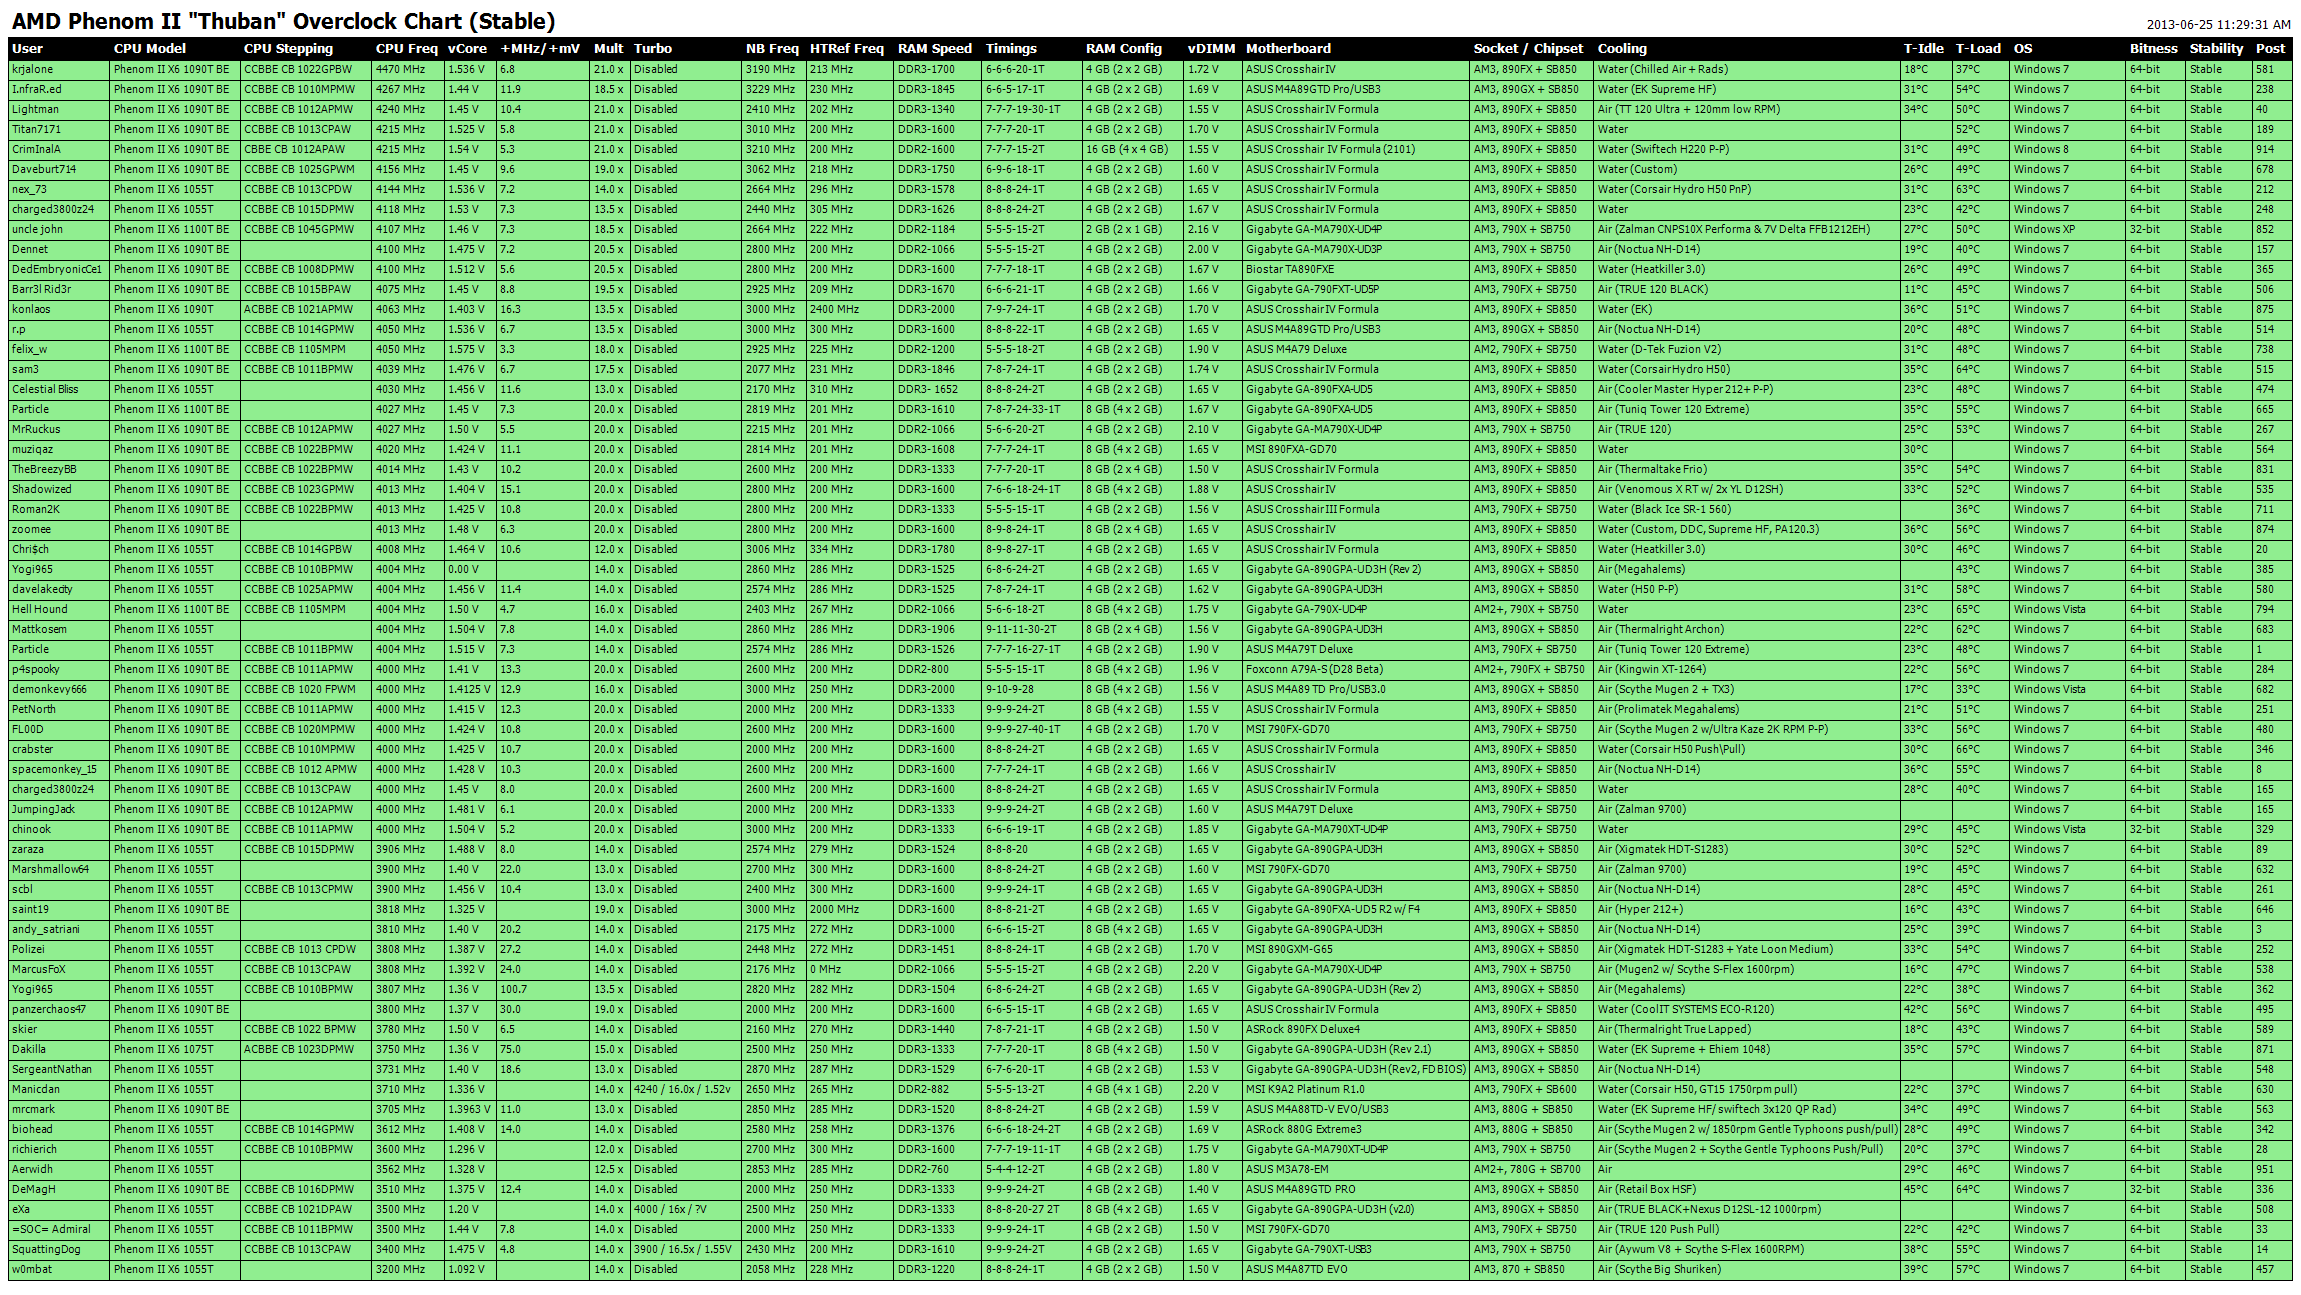
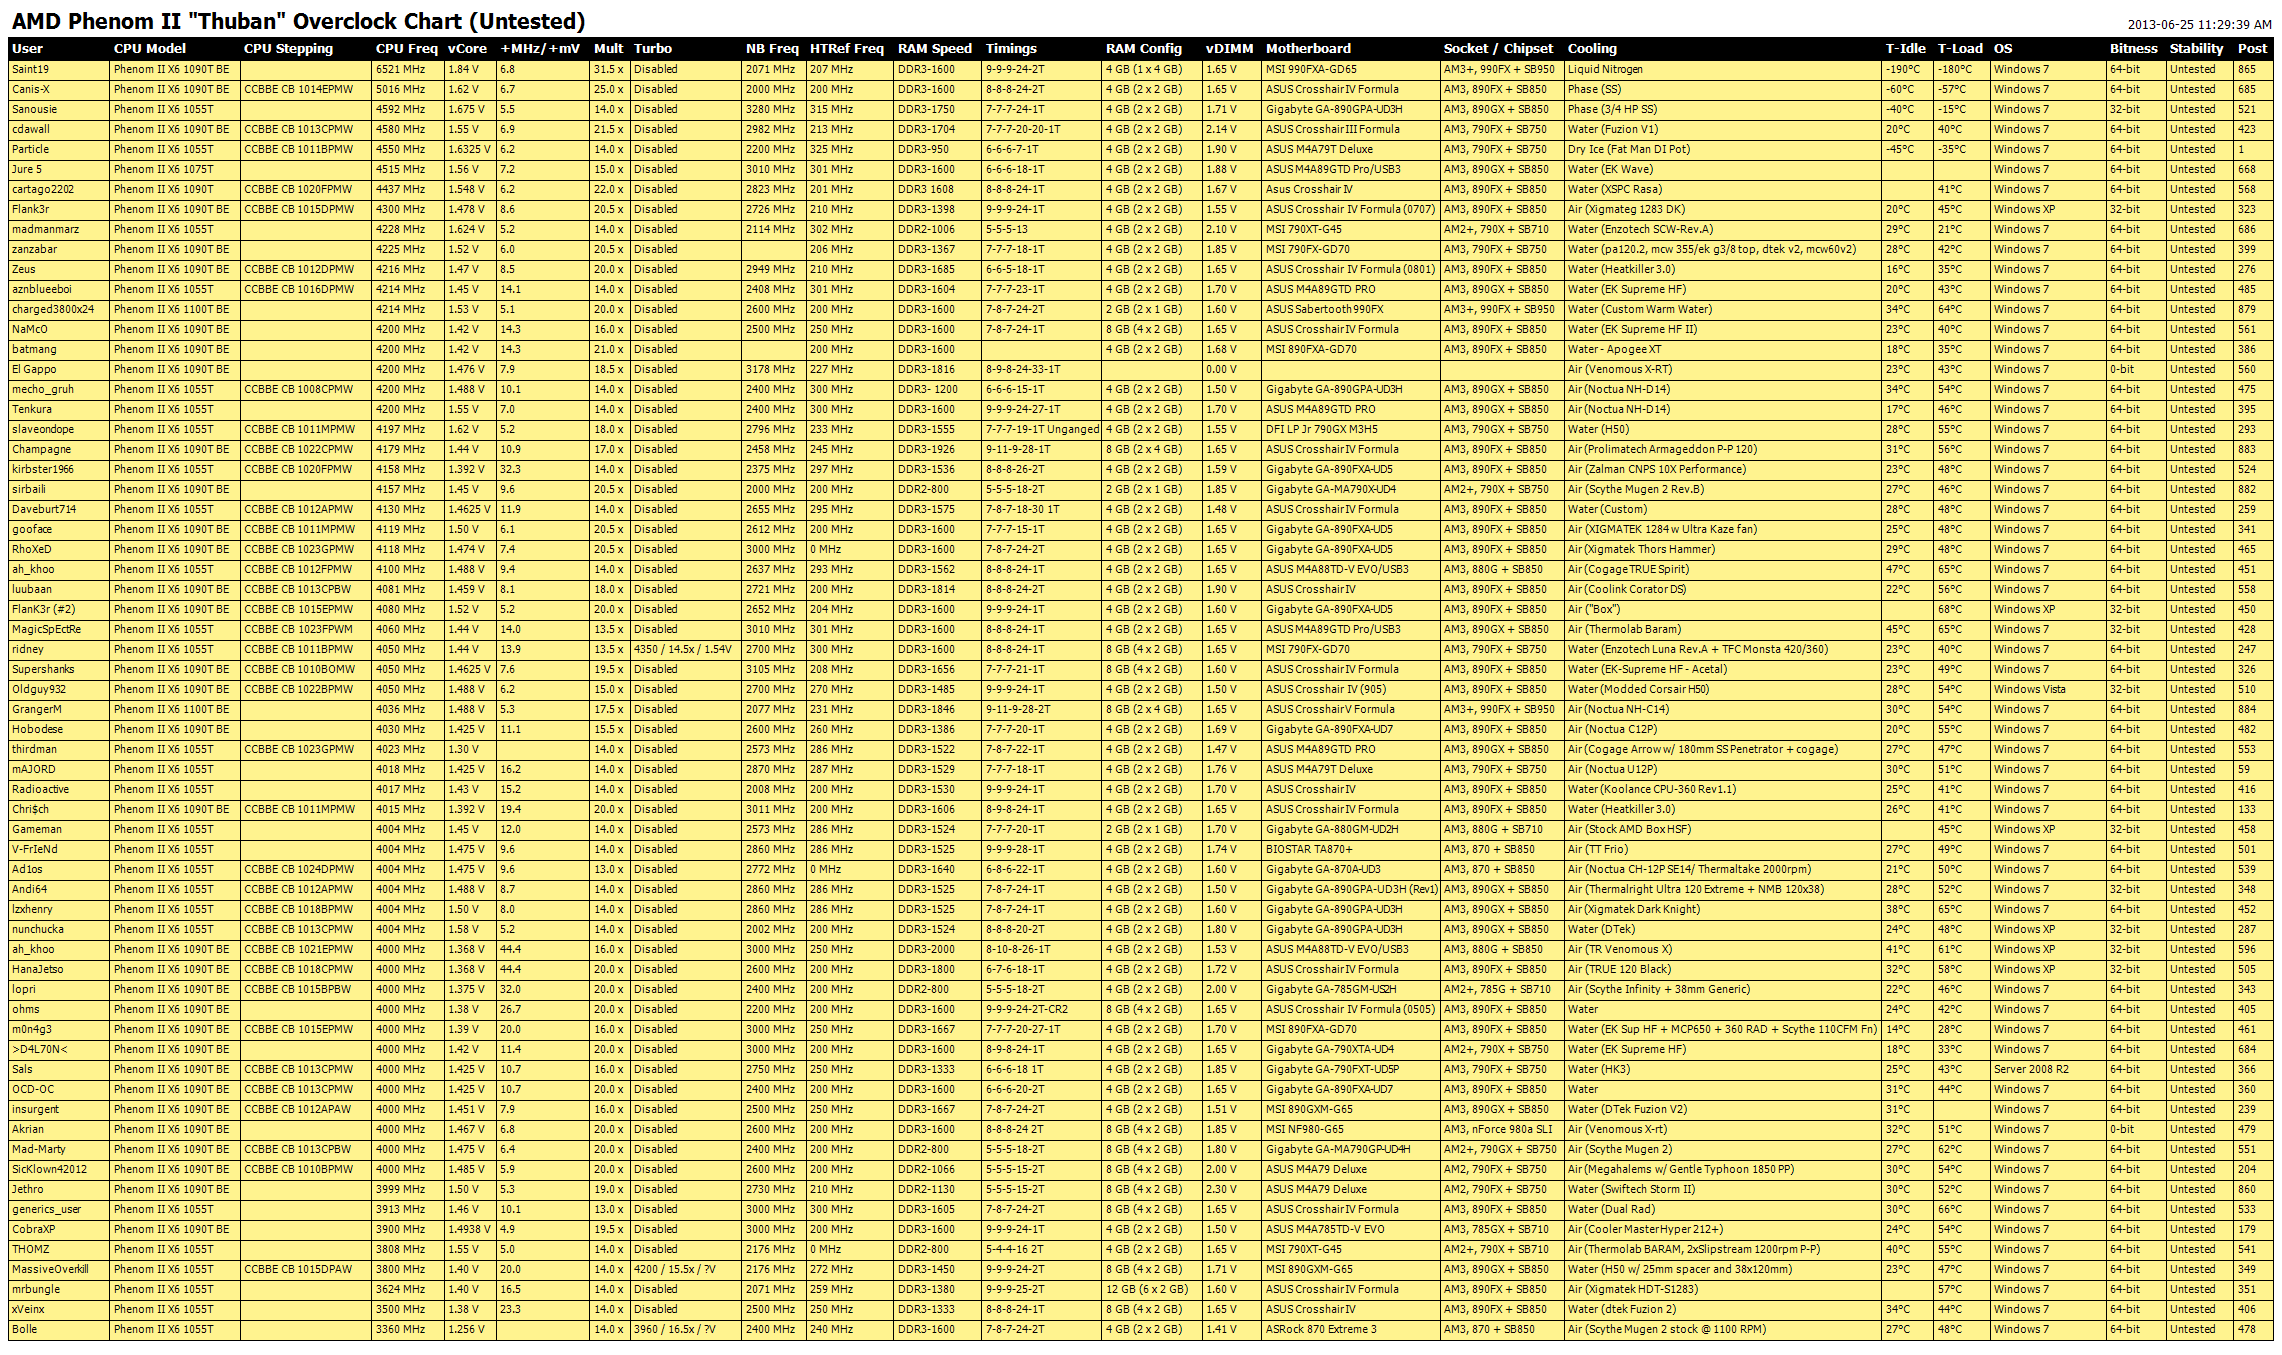
The charts, sorted by CPU frequency first, then vCore, then NB frequency. After that they're sorted by Poster and finally post number.
Thanks to the new forum software upgrade, full-sized images are no longer possible within the thread itself. Grumble. Click on "View Full-Sized" above any image you want to see.
View Full-Sized
View Full-Sized
View Full-Sized
View Full-Sized
View Full-Sized
Need help locating your "stepping"?

 Particle's First Rule of Online Technical Discussion:
 Rule 1A:
 Rule 2:
 Rule 2A:
 Rule 3:
 Reply With Quote


Bookmarks