


Hello. it's newbie on this forum.
I'm not sure that whether I can upload this kind of bench on this board. (this board seems to consist of reviews of "a certain model of" HW... am I right?)
Please announce me whenever I (unintentionally of course ;-)) forbid the rules of this forum.
...okay. then let's back to the main context.
I benched my memory with several different ram timing settings. Tests include:
1. Super PI 32M digits of Pi calculation
2. Lavalys Everest Cache & Memory Benchmark
3. Video Transcoding (1080p TP -> mkv using H.264)
and tested ram timing items are:
1. CL: 6~11
2. tRCD: 9~11
3. tRP: 6~11
4. tRAS: 24~30
5. Command Rate: 1 / 2
6. tRC: 15~40
7. tRFC: 90ns / 110ns / 160ns / 300ns 350ns
8. tREF: 3.9ms / 7.8ms
(for the test, except tRC and tREF, the lowest value is default. tRC and tREF have their highest value as default)
and other system setup is:
- CPU: AMD Phenom II X6 @ 4.0GHz / NB 2.75GHz
- M/B: ASUS M4A89GTD-PRO USB3
- RAM: G.SKILL PIS PC3-19200 CL9 4GB (2GB x 2) @ 2000MHz
- Storage: Intel X25-M G2 80GB
- PSU: PC Power & Cooling Silencer 910W 80PLUS Silver
Super PI test
Note: sorry for 'magic graph'. since it takes numerous min. for 32M Pi caculation, results are differred only by a very second. so it's unavoidable to show 'meaningful' graphs.
1. CL Test
2. tRCD Test
3. tRP Test
4. tRAS Test
5. Command Rate Test
6. tRC Test
7. tRFC Test
tRFC and tREF are indexed by actual time (second) while others by clock count. It's because they directly indicate characteristics of electrical working mechanism of a memory chip. Both are related to a memory's refresh rate, tREF determines how frequently a chip shall be refreshed and tRFC determines the time interval from the moment of 'refresh' (memory access is unavailable) to when a memory access is back to available. So in case of tREF, the bigger value the better at performance, but the contrary is more likely at stability.
8. tREF Test
As of now, we covered all 8 elements. Let's see overall analysis.
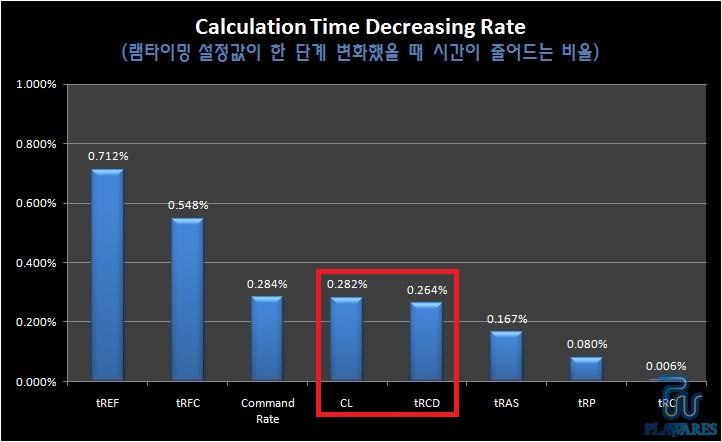
Overall Analysis: Super PI
(...sorry for Korean letter. actually I uploaded this bench to my private blog) The title of the graph is that 'how a ram timing value affects performance when we change just '1-degree' of ram timing option provided by BIOS'. As you see, tREF affects the most but not more than 1%, and followed by tRFC-Command Rate-CL. It's impressive that well-known items such as CL, tRCD affect far less than 'minor' items such as tREF and tRFC.
Then let's go to next test result - Everest Cache & Memory Benchmark
Everest Cache & Memory Benchmark
- Memory Bandwidth test -
Each Everest test consists of two parts: Bandwidth and Latency.
Let's cover the bandwidth results first.
1. CL Test
2. tRCD Test
3. tRP Test
4. tRAS Test
5. Command Rate Test
6. tRC Test
7. tRFC Test
8. tREF Test
Like Super PI test and unlike other ram timings, bigger tREF value is better at performance.
Let's see overall analysis.
Overall Analysis: Read Bandwidth
Overall Analysis: Write Bandwidth
Overall Analysis: Copy Bandwidth
In read bandwidth test, 4 most-affective ram-timing items are flatted around 2%. Command Rate-tREF-CL-tRFC are said affective items and other 4 ram-timings merely affect performance. But write bandwidth remains nearly unchanged during various ram-timing values has changed. In case of copy bandwidth, only tREF and tRFC exceed the affectiveness of 1% and others remain below 1%. In other words, only tREF and tRFC are actually affect copy bandwidth.
Then let's go to latency test.
- Latency test -
1. CL Test
In latency test, change of CL value derives nearly a linear trendine.
2. tRCD Test
Seems merely changed, but it's not 'that small' compared to latter results.
...At least the trendline is undoubtedly linear.
3. tRP Test
Little fluctuation is appeared, but it seems random empirical error.
4. tRAS Test
5. Command Rate Test
6. tRC Test
Guess there's only superior advantage on the value "tRC 25"? I guess not.
7. tRFC Test
8. tREF Test
Overall Analysis: Latency
Latency test seems more dependant to ram-timing values than two previous tests (Super PI & Bandwidth). 3 items exceed 1% of affectiveness and among them, 2 exceed 2.5% to performance. 2.5% performance increment upon no CPU / RAM clock change is not just a small variation.
Then let's go to the last test: video transcoding.
Video Transcoding test
This test is to measure the time of converting 1920x1080 TP file to MKV, same resolution. H.264 codec is used. No GPGPU acceleration.
1. CL Test
2. tRCD Test
3. tRP Test
4. tRAS Test
5. Command Rate Test
6. tRC Test
7. tRFC Test
8. tREF Test
Overall Analysis: Video Transcoding time
Similar to Super PI test, no items reached 1% and tREF marks the top. below CL, affectivenesses cannot even reach one third percent. But still remember: nearly 1% reduction in transcoding time with CPU & RAM clock remain unchanged is not 'that' small.
So, by far, we covered 3 areas: Pi calculation, Synthetic bench, and Video transcoding. Let's see how a ram-timing's affectiveness differ through that benchmark areas.
Affectiveness among test areas
As you see, tRP/tRAS and tRC have nearly "no" impact on performance.
Then let's calculate average affectiveness:
Average = {Super PI + (Read + Write + Copy)/3 + Latency + Encoding}/4
(name of each term indicate a ram-timing's affectiveness on that test area)
Average affectiveness by Ram-timing
For average, affectiveness CL-Command Rate-tRFC are nearly flat around 1% and tREF and tRCD are around three quarter % and a half % respectively.
I think it would be the best for me to help other guys to think like below among various specs of rams:
"6-9-6 vs 7-7-7? since CL's affectiveness on Super PI is bigger than twice of tRCD's affectiveness, former model would be faster than latter on Super PI."
Thanks for reading SCROLLious () post. Have a nice day~
ps. this bench had also been uploaded to my private blog: http://udteam.tistory.com/192
ps2. 24/7 running setting of my system is:


 Reply With Quote


 Saaya yupp, I agree


 maybe other platforms (ex: INTEL 1156) have different results. I wish I could do & compare results of further tests among several different platforms.
 Thank you for the great review.
  is the remedy

Bookmarks