

Steve,
There's a lot more of course, I'll post the rest of them tomorrow along with a some graphs.


Steve,
There's a lot more of course, I'll post the rest of them tomorrow along with a some graphs.
-
Hardware:
SteveRo, if you read this, in wich thread do you want the 3D representation of your frankenstein x25-V RAIDs from ICH10R?
I'll make a new thread where comparisons between people come, probably some time tomorrow. It will be an orgy of graphs and diagrams
@Anvil: for 24/7 I moved back to 128k stripe, do you think staying at 16k is worth the extra wear? Especially considering how new the c300s are nobody really knows for sure how fast degradation will come.
slowpoke:
mm ascension
gigabyte x58a-ud7
980x@4.4ghz (29x152) 1.392 vcore 24/7
corsair dominator gt 6gb 1824mhz 7-7-7-19
2xEVGA GTX TITAN
os: Crucial C300 256GB 3R0 on Intel ICH10R
storage: samsung 2tb f3
cooling:
loop1: mcp350>pa120.4>ek supreme hf
loop2: mcp355>2xpa120.3>>ek nb/sb
22x scythe s-flex "F"
mbreslin,
I don't know yet, the LSI is not the same as the ICH.
The C300 is very much like the Intel drives, they seem to work well in all configurations, I wouldn't change the stripe size for now.
I'll continue my testing and I'll let you know what I find out.
As for the extra wear, I don't think it makes that much of a difference.
My Intel drives have been running for 7-8 months at low stripe sizes, I'll check Host Writes on the drives.
BTW, are you running all drives in one array?
I've had a few disturbing dropouts on one of my C300s on the LSI, quite strange imo.
It only happens using AS SSD when Write Back is activated and only while measuring Write Access time.
(it has happened twice, once a week ago while testing one drive and it happened again last night using 2 drives)
-
Hardware:
AS SSD Benchmark
C300 ICH10R 2R0
4KB stripe size
as-ssd-bench Volume0 30.04.2010 22-22-36_wbcOff.png as-ssd-bench Volume0 30.04.2010 22-11-25_wbcOn.png
8KB stripe size
as-ssd-bench Volume_0000 30.04.2010 23-15-41.png as-ssd-bench Volume_0000 30.04.2010 23-36-02.png
16KB stripe size wbc only
as-ssd-bench Volume_0000 01.05.2010 02-30-59.png
32KB stripe size
as-ssd-bench Volume_0000 01.05.2010 12-24-31_wbcOff.png as-ssd-bench Volume_0000 01.05.2010 12-59-03_wbcOn_clean.png
64KB stripe size
as-ssd-bench Volume_0000 01.05.2010 13-34-12_wbcOff.png as-ssd-bench Volume_0000 01.05.2010 14-07-09_wbcOn.png
128KB stripe size
as-ssd-bench Volume_0000 01.05.2010 18-02-19_wbcOff.png as-ssd-bench Volume_0000 01.05.2010 18-37-01_wbcOn.png
-
Hardware:
Anvil - looking good across the board, wbc gives a very nice increase in 4k writes, very impressive!
why is access time on writes so high? - 0.4 sec when wbc is off?
Is that normal, maybe I'm reading that wrong.
Last edited by SteveRo; 05-02-2010 at 08:14 AM.
For comparison to C300 - below is acard 9010, on a GGBT X58extreme mobo, W3520 proc no oc.
From left to right
Acard set as single drive on ich10R, ide mode
Acard set as single drive on ich10r, ahci mode
Acard set as R0, (2xR0), wbc off
And lastly - on far right Acard set to R0 (2xR0), wbc on
Steve, if you read this, pleese reply in wich thread you want the 3D diagrams of your Frankenstein RAIDs from ICH10R. I'm making screenshots of them now, they're done in the excel document.
If there's no reply by the time i'm done, i'll post it here.
@Anvil: yes I use all 8 drives in one array, can you explain what you mean by dropout?
Edit: Here is my 24/7 setup. 8R0 128k stripe wbc on
Last edited by mbreslin; 05-02-2010 at 10:00 AM.
slowpoke:
mm ascension
gigabyte x58a-ud7
980x@4.4ghz (29x152) 1.392 vcore 24/7
corsair dominator gt 6gb 1824mhz 7-7-7-19
2xEVGA GTX TITAN
os: Crucial C300 256GB 3R0 on Intel ICH10R
storage: samsung 2tb f3
cooling:
loop1: mcp350>pa120.4>ek supreme hf
loop2: mcp355>2xpa120.3>>ek nb/sb
22x scythe s-flex "F"
I recommend you post them in the x25-v thread.Originally Posted by GullLars

Since i got no reply, here's some 3D diagrams showing off the random read performance of SteveRo's Frankenstien RAID of 4x25-V, some are flashed Kingston V 40GB (therefore frankenstein).
Both sets are 4R0 x25-V ICH10R 16KB stripe, WBC off. First set is stock clocks, second is 119 PCIe and 4,8Ghz HT off on 980x. The OC makes a difference.
Comment: You'll notice 3-4 drops in performance around 8-16KB, this can happen some times, and is the reason this is only a "fairly accurate" representation of performance. For more smooth graphs, i'd use 5 data sets, discard the best and worst numbers for each datapoint, and take the average of the 3 in the middle. This however is a bit too much work for this type of "overlook".
So, here we go:
No OC:
OC:
I also have graphs comparing OC to stock, as a spoiler, the OC has a 10-25% advantage at smaller blocks, and 5-15% at larger blocks. The results are consistent, but there is a drop for OC at 16KB QD 8-16 (it happens), but this likely represents an anomaly and not the actual performance at those points.
EDIT: i saw Steve's reply too late. If a moderator sees this, pleese move this post.
For now, i'll post a link there to this post.
Write Access time is quite high on the C300, don't know why, the performance is still superb. GullLars had a theory a few pages back.
(write attenuation in the cache, can't really answer that question but he could be right)
Using the 9128 write access time is ~0.7ms, even worse
By dropout I mean the drive is dropped from the array, the controller starts beeping and the Virtual Disk is gone. The dropped drive ends up as a foreign drive/configuration.
I need to disconnect the drive from the controller and reattach it to continue working. (could be the drive but it only happens using AS SSD)
I'll check what parameters I've been using using my 2 drives on the 9260, from what I can recall from yesterday my AS SSD score is higher than yours.
If I had 8x C300 I would have split them into 2 or more arrays.
(you are living on the edgeimho)
By splitting them in two you'd end up with 2 really fast drives instead of one.
(but that's just me)
edit:
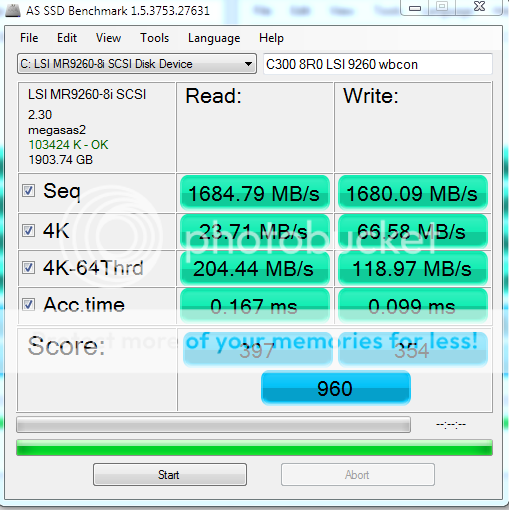
2R0 C300 using the LSI 9260
as-ssd-bench LSI MR9260-8i SC 01.05.2010 22-34-35.png
I stopped testing after this one as the drive was dropped from the array having changed to WBC.
WBC could bring more performance, I'll retry later.
Last edited by Anvil; 05-02-2010 at 11:12 AM.
-
Hardware:
I've gathered all my data from the 0,5-64KB QD1-128 project in 1 file, and i will use it for making graphs for the new thread i will make, but before i start, i'd like to know if any of you have result files for this config that i don't have included.
I've skimmed through the C300 2R0 results you posted on the previous page anvil, and the numbers look good, but i miss the QD 128. If you haven't put OS on the C300's yet, it would be great if you could run through block sizes 0,5-64KB with QD 128, then i'll have another setup in the lineup. (EDIT: and for all the stripe sizes :P)
If you have numbers for single C300 or single/2R0 Vertex LE with the config, it would also be nice. If not, i can always add them later if you run the config, but then it won't get in the initial graphs i'll post in the new thread.
EDIT 2: here's the numbers i have so far in a xlsx document
Project 0,5-64KB QD1-128 1 may 2010.zip
Last edited by GullLars; 05-02-2010 at 11:23 AM.
I've always wondered why I don't do better at qd64 maybe 8 c300 is overloading the 9260. As for 'living on the edge' I make an image now and then when I think I've done something I don't want to lose, other than that I don't do any 'mission critical' stuff with my pc. I don't mean to sound arrogant or whatever but this build was really just an excuse to play with all the newest/best hardware, my usage pattern doesn't warrant most of what's in my computer. I look forward to seeing what crucial does with the new firmware update coming supposedly in a week or two. Also if the 1880 turns out to be awesome I'll be grabbing that and possibly 4 more c300s, for no reason other than why not!
Edit: I just wanted to add that I thought that's what you meant by dropout, wanted to be sure, I've never lost a disk from the array even temporarily. There was once where (before even making the vd) that not all disks showed up but I'm pretty sure it was a bad cable job on my part.
slowpoke:
mm ascension
gigabyte x58a-ud7
980x@4.4ghz (29x152) 1.392 vcore 24/7
corsair dominator gt 6gb 1824mhz 7-7-7-19
2xEVGA GTX TITAN
os: Crucial C300 256GB 3R0 on Intel ICH10R
storage: samsung 2tb f3
cooling:
loop1: mcp350>pa120.4>ek supreme hf
loop2: mcp355>2xpa120.3>>ek nb/sb
22x scythe s-flex "F"
mbreslin,
I don't think you are overloading the 9260, I've reached >2GB using my Intels, both random and sequentially.
You should try using WT and Disk Cache Policy Enabled.
As long as you do backups you should be fine, 8R0 is still living on the edge
GullLars,
I've stopped doing QD 128.
I edited the script to include 128KB and 256KB block sizes, it's more meaningful than QD>64
If I buy another drive I might include QD128 just for curiosity.
I might be able to do a few separate runs at QD128, just tell me what block sizes and I'll look into it.
edit:
I've got iometer results for all drives using 512B-256KB QD1-64.
If you're still interested just let me know.
Last edited by Anvil; 05-02-2010 at 11:54 AM.
-
Hardware:
Sure, just post em. I can use them in cut down comparisons, or comparisons against others who also include 128 and 126KB.
I have your results for 2R0 C300.
I'll include them with the others, and just treat them as missing the QD 128 datapoint and not include 128/256KB in graphs where the others don't have those data points.
ow, wow,
nice results everyone,
WB cache indeed seems to give a nice push to 4KB write bandwidth at the 2x C300 RAID 0 graphs,
you can notice the nice access time drop from ~0.44ms write through to 0.14, about 0.3 whole ms.
32KB and 128KB stripe sizes seem to give the best results, the 64KB seems to skew it a little bit with a small access time penalty yet it could be a negligible inaccuracy.
steve:
a single ACARD vs 2 seems to give an all right scaling, seems the write through is much better with the ACARD setup, least the sequential performance, 4KB write at QD of 64 4KB seems to be the only thing that gains anything with the write back on.
strangely, the access time drops a bit with write back on, yet results are showing a severe sequential performance decrease..
mberslin,
4KB on the 9260 array doesn't seem to scale almost at all, which is strange compared to tiltevros results with the 8x X25-M's which can reach up to 100K IOPs at QD of 32 apparently with only a single worker..
that is strange, Computurd has said he has reached about 200K IOPs with his 9260 too (probably at QD of 128 or 256), and anvil's results show about 320MBps each R&W QD of 64 with 2 drives, so this is a bit of strange.
GRAPHS:
seems steve array has reached 10k IOPs less then anvil did on a quad core? at QD of 32 and 4KB blocks.
the highest the array has reached is 171K IOPs at 512B at QD of 64, while anvil's array has reached apparently 177K IOPs at the same QD and 183K IOPs at the QD of 128 (with no overclocking? probably).
so this might be an array bottle neck, or a better array by anvil, maybe different motherboard manufacturer, model etc.
the OC is pulling the array from ~133K IOPs to 171K IOPs or ~25% more, and a strange drop at 8KB QD of 64 where you can see the grayish graph suddenly disappears on the non OC'ed array and bandwidth goes down to 312MBps, lower then the 32 and even the 16 QD, and access time grows from predicted about 1ms to whooping 3.4..
on the OC'ed array, this phenomenon, is gone,
maybe a background process which was running in the middle of the benchmark..?
don't really know.
Last edited by onex; 05-02-2010 at 01:10 PM.
I've worked with 20+ sets of results from that config, and these dropps do occur from time to time, for no apparent reason. It could be a power saving feature on the CPU (it's a single-thread test), or some background process taking up IO/CPU.
Since Anvil tested C300 at different stripes for a range of block sizes and Queue Depths, I decided to show you something you maybe haven't seen before, and can help illustrate the benefits of different stripe sizes
The series are Stripe sizes, one graph for each block size (i dropped 0,5KB since it was basically identical on all stripes). Bandwidth is on the Y axis.
I'll make a couple more graphs showing scaling by block size instead of QD at some selected QDs. I'm thinking QD 1, 8 and 64. I'll blow them up bigger so it's easier to see the differences.
I can blow up any of the 9 graphs above if you want, or share the xlsx file with data and graphs if you want to play with the numbers yourselves.
EDIT: fixed the order of the graphs, i had somehow moved 8KB to the bottom :P
Last edited by GullLars; 05-02-2010 at 03:10 PM.
More graphs!
Bandwidth scaling of different stripe sizes by block size at specific queue depths:
To put it in words: Smaller stripes are better for at low to moderate QD, the smaller stripe, the earlier the effect kicks in.
Larger stripes are better for (very) high QD and large blocks.
EDIT: Also, it seems like the C300s don't like block sizes above 128KB for random reads when there is a queue.
EDIT2: If people want graphs for the queue depths between the ones posted, shout out and i will post
Last edited by GullLars; 05-02-2010 at 03:35 PM.
no any severe difference, i would have kept it generally at 32, unless the gap expands critically at bigger then 256KB blocks.
Thanks GullLars,
Not much difference between the stripe sizes, 32KB looks like the winner for 2 drives on the ICH.
I'll dig up the rest of the result files tomorrow. (been busy)
I've also got the 4R0 C300+LE result files
-
Hardware:
Dude, how many of which SSDs do you have now?
Do you have so much money lying around that after a nice night out in Amsterdam you can get an SSD every day?
(yes, I know it's not in Norway, but it's close enough for everyone to figure the point)
P5E64_Evo/QX9650, 4x X25-E SSD - gimme speed..
Anvil - how about some pcmv HDD test results for both 2xLE and 2xC300
also, how about no oc vs oc?
I am curious if we can get the 4KB reads at low QD higher - i would like to see an oc'ed ich10/2xC300 approach 70MB/s to beat acards.
Last edited by SteveRo; 05-03-2010 at 03:49 AM.
Steve
I'll post my results for the PCMV HDD tests sometime later today.
The results are OK but not breathtaking.
I'm struggling getting my UD7 stable with PCIE above 102 for some reason.
All I've got on that rig is the 5770 GPU, nothing else.
What settings are you using to reach 115 or more?
-
Hardware:
 Posting Permissions


 Reply With Quote
Bookmarks