MMM
Page 1 of 6 1234 ... LastLast
Results 1 to 25 of 132

Thread: Meausuring QD in win7

  1. #1
    Xtreme Guru
    Join Date
    Aug 2009
    Location
    Wichita, Ks
    Posts
    3,887

    Meausuring QD in win7

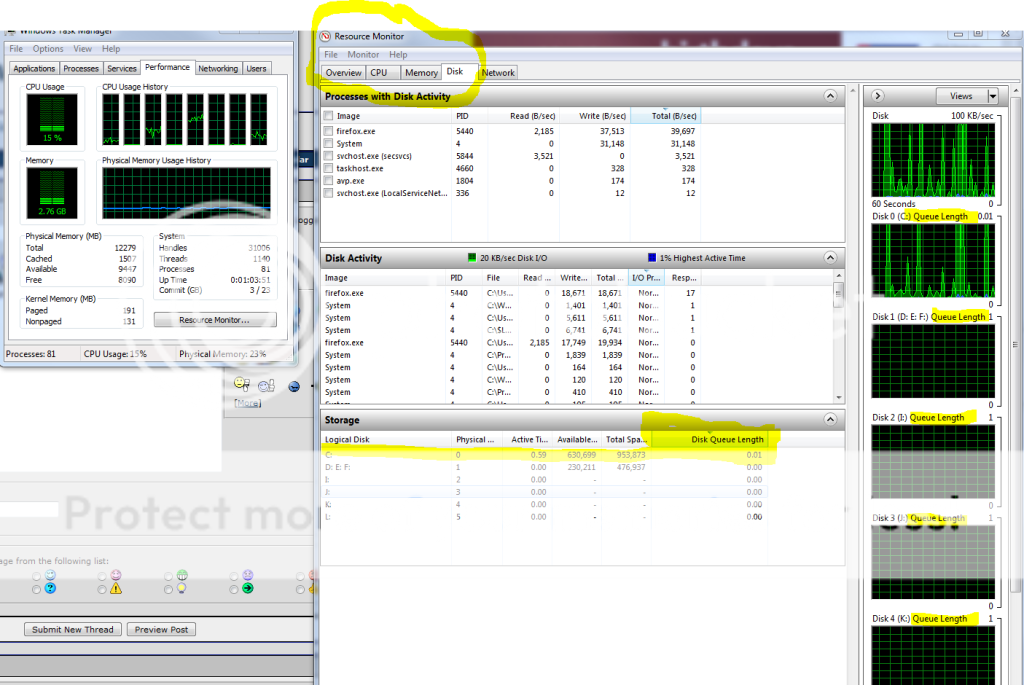
    just wondering if you guys think that this is accurate:


    i have used this quite a bit, of course the disk queue number fluctuates. however, it rarely goes over one. unless i am benchmarking of course.
    howeve4r, i think that shows that it gives accurate numbers. when loading games, it never goes above 1 or at least very rarely. this makes me wonder if the operating system is being fed info at a fast enough rate that maybe it doesnt stack queue depths? because the operating system or file system handles the queue depth, so that would not be a static number, or am i incorrect in that?
    i dunno just thoughts. maybe it isnt accurate at all. i think it is though.
    "Lurking" Since 1977


    Jesus Saves, God Backs-Up
    *I come to the news section to ban people, not read complaints.*-[XC]Gomeler
    Don't believe Squish, his hardware does control him!

  2. #2
    Xtreme Cruncher
    Join Date
    Dec 2008
    Location
    The Netherlands
    Posts
    896
    Not sure, I've noticed that as well in windows 7, but haven't paid much attention to it. If game and program loading doesn't go above a QD of 1, this could mean a big thing for raid0 SSD users. A smaller stripe size would yield a better performance, because of the fact it would be able to read small files from multiple drives as well. Most people tend to use a big stripe size, because of it's superior benchmark performance, as the QD does go up in those tests. Would be _very_ interesting to see some loading tests of games with different stripe sizes on different controllers. I'm currently only using a single Vertex 120gb, but I might go with raid0 in the future, because I need some extra space. I could do some tests on the ICH10R, but I won't use raid to atleast February.

  3. #3
    Xtreme Guru
    Join Date
    Aug 2009
    Location
    Wichita, Ks
    Posts
    3,887
    you sir seen exactly where i was going with this. +1
    it would also mean that whatever controller had the best iops at 1 queued is the best. period. but not at just one size. at many sizes and both ranodom/sequential. but key is 1 queue
    "Lurking" Since 1977


    Jesus Saves, God Backs-Up
    *I come to the news section to ban people, not read complaints.*-[XC]Gomeler
    Don't believe Squish, his hardware does control him!

  4. #4
    SLC
    Join Date
    Oct 2004
    Location
    Ottawa, Canada
    Posts
    2,795
    Have you tested with IOMeter? Run tests with different QD and see if the monitor shows you the correct QD.

  5. #5
    Xtreme Guru
    Join Date
    Aug 2009
    Location
    Wichita, Ks
    Posts
    3,887
    yup. works. the only time i have seen it go above two is when benchmarking. when you load it up the QD scales perfectly with whatever QD you are running. do you have win7?
    Last edited by Computurd; 12-30-2009 at 07:58 PM.
    "Lurking" Since 1977


    Jesus Saves, God Backs-Up
    *I come to the news section to ban people, not read complaints.*-[XC]Gomeler
    Don't believe Squish, his hardware does control him!

  6. #6
    SLC
    Join Date
    Oct 2004
    Location
    Ottawa, Canada
    Posts
    2,795
    I had beta for a few months and I do remember that monitor. I saw results similar to yours and I considered them bs at that point in time. Anand did say they got like 7 or 8.

  7. #7
    Xtreme Guru
    Join Date
    Aug 2009
    Location
    Wichita, Ks
    Posts
    3,887
    crysis barely got over 2. and that was for a few seconds. maybe one second. it loads a little fast i think it might be specific to whatever game is running. how is queue depth figured though? what controlls it? the program or the OS? because if the operating system is assigning queue depth based upon the needs of the OS then i have theories...

    also consider that when you run i.o meter whatever qd you use scales perfectly with the monitor. i am not sure maybe this is in previous versions of win, we need a vista user to chime in as well. seeing as how it is the operating systems built in controller i have a feeling it may be very accurate. going to load some l4d tommorow night and test that to see QD with it. supreme commander does not go over 1.
    "Lurking" Since 1977


    Jesus Saves, God Backs-Up
    *I come to the news section to ban people, not read complaints.*-[XC]Gomeler
    Don't believe Squish, his hardware does control him!

  8. #8
    SLC
    Join Date
    Oct 2004
    Location
    Ottawa, Canada
    Posts
    2,795
    If everything was QD=1 then most stuff would be a function of the access times (since access time is 1s divided by IOPS at QD=1), which it is not. This can clearly be seen by comparing SSDs with HDDs which have access times of 100x more, but are really nowhere near that much slower.

  9. #9
    Xtreme Guru
    Join Date
    Aug 2009
    Location
    Wichita, Ks
    Posts
    3,887
    true, and with further loads of different programs i have gotten higher queue depths i have seen a 6 LOL with the gpg net client. there are varying qd in usage of course. it is just amazing how low the averages are. form what i have seen low queue depths are a very high percentage.
    "Lurking" Since 1977


    Jesus Saves, God Backs-Up
    *I come to the news section to ban people, not read complaints.*-[XC]Gomeler
    Don't believe Squish, his hardware does control him!

  10. #10
    Xtreme Mentor
    Join Date
    Feb 2009
    Posts
    2,597
    A run of AS Benchmark shows a correct correlation of qd with that shown on the Win 7 Disk Resource monitor.

    Most desktop systems have less than 1 outstanding IO during normal operation, but under heavy multitasking you can see the IO queue depth hit 4 or 5 IOs for writes. Going much above that and you pretty much have to be in a multi-user environment, either by running your machine as a file server or by actually running a highly trafficked server. Source: AandTech

    100% random writes, IO queue depth 1 4KB 16KB 32KB 64KB 128KB
    OCZ Core (JMicron, MLC) latency = 244ms 243ms 241ms 243ms 247ms

    The real issue is the small random write access penalty that can be a problem even at qd1 as can be seen above or as highlighted here
    Last edited by Ao1; 12-31-2009 at 05:58 AM.

  11. #11
    Xtreme Member
    Join Date
    May 2007
    Posts
    191
    Quote Originally Posted by audienceofone View Post
    A run of AS Benchmark shows a correct correlation of qd with that shown on the Win 7 Disk Resource monitor.

    Most desktop systems have less than 1 outstanding IO during normal operation, but under heavy multitasking you can see the IO queue depth hit 4 or 5 IOs for writes. Going much above that and you pretty much have to be in a multi-user environment, either by running your machine as a file server or by actually running a highly trafficked server. Source: AandTech

    100% random writes, IO queue depth 1 4KB 16KB 32KB 64KB 128KB
    OCZ Core (JMicron, MLC) latency = 244ms 243ms 241ms 243ms 247ms

    The real issue is the small random access penalty that can be a problem even at qd1 as can be seen above or as highlighted here
    You are using the wrong tool mate, use performance monitor and remove CPU, add the local disk tasks you see in my pic, and sett graph length to 60 sec.... Reboot and load programs, one after another, within these 60 sec. and take a pic of the result..

    My graph shows the opening of: Event Viewer, Services, Windows Mail, Steam, Messenger and Everest... What you see on the graph is actual QD as it happens, average is useless as it counts idle time as well... Here you can see what happens to QD as it happens and why a SSD with good QD performance is prefered. You can test whatever app/game you want, just make sure it's accessing the disk fresh after a reboot and not from ram..
    If you want to show extremely detailed results on every app/game, set graph length to 10-30 sec., mine are at 100 sec. and seperates colors with less details..

    Last edited by Ourasi; 12-31-2009 at 04:16 AM.
    | Ci7 2600k@4.6ghz | Asus SaberTooth P67 | Sapphire HD7970 | Samsung B555 32" | Samsung 840 PRO 128gb + 2xIntel SSD 520 120GB Raid0 + 2xC300 64GB Raid0 | Corsair Vengeance 16GB DDR3-1600 8-8-8-24 | Vantage GPU=40250 |

  12. #12
    Xtreme Mentor
    Join Date
    Feb 2009
    Posts
    2,597
    ^ Thanks

    Ok here is a shot after a reboot and opening the following one after the other:

    IE8, WMP, Word, Live mail, Asus audio centre, Intel SSD toolbox, Chrome, COD MW2 MP. (Shut down COD after loading to game) Open LFD2 to load game and then close.

    The scales differ, but I think that is showing a max current queue depth of 6

    Last edited by Ao1; 12-31-2009 at 05:20 AM.

  13. #13
    Xtreme X.I.P.
    Join Date
    Apr 2008
    Location
    Norway
    Posts
    2,838
    audienceofone

    If the scale is 10 and the graph shows 60 then your assumption would be correct.

    You could try running 4K QD4 using CDM3 TP and it should show ~40 using the same scale.
    -
    Hardware:

  14. #14
    Xtreme Guru
    Join Date
    Aug 2009
    Location
    Wichita, Ks
    Posts
    3,887
    @anvil-thanks man very very informative, i am able to get the QD to scale up very easily with certain tasks, however they are very low as a rule under 10.
    dude you can really optimize and display that info different ways, change the scaling and ways of displaying it...definitely gonna play around with it?

    NOW all i need to know is how are QD assigned? what makes the determination of the current queue depth, is it the operating system or the program itself?
    Last edited by Computurd; 12-31-2009 at 07:58 PM.
    "Lurking" Since 1977


    Jesus Saves, God Backs-Up
    *I come to the news section to ban people, not read complaints.*-[XC]Gomeler
    Don't believe Squish, his hardware does control him!

  15. #15
    SLC
    Join Date
    Oct 2004
    Location
    Ottawa, Canada
    Posts
    2,795
    Quote Originally Posted by Computurd View Post
    @anvil-thanks man very very informative, i am able to get the QD to scale up very easily with certain tasks, however they are very low as a rule under 10.
    dude you can really optimize and display that info different ways, change the scaling and ways of displaying it...definitely gonna play around with it?

    NOW all i need to know is how are QD assigned? what makes the determination of the current queue depth, is it the operating system or the program itself?
    The QD depends on the coding of the program

  16. #16
    Xtreme Guru
    Join Date
    Aug 2009
    Location
    Wichita, Ks
    Posts
    3,887
    well maybe they could alter that to higher queue depths to load things faster? or maybe WE could alter it!!
    Last edited by Computurd; 12-31-2009 at 11:17 PM.
    "Lurking" Since 1977


    Jesus Saves, God Backs-Up
    *I come to the news section to ban people, not read complaints.*-[XC]Gomeler
    Don't believe Squish, his hardware does control him!

  17. #17
    Xtreme Mentor
    Join Date
    Feb 2009
    Posts
    2,597
    Can someone please help me understand how queue depths work? For example on ASS benchmark the 4k test is queue depth one. The 4K-64 test is a queue depth of 64 and read/ write speeds increase.

    In England we normal associate a queue with waiting and we like to form an orderly queue whenever the opportunity arises

    4k reads improve around 700% between qd1 & 64 on a G2.

    4K writes improve around 40% between qd 1 & 64 on a G2

    Why do read & write speeds increase so much with queue depth? Is it because the read/ write operations are occurring in parallel (not really a queue as such) or is it because the files are being stacked up in a queue to allow read/ writes to occur in sequence rather than in random? (Sequential read/ writes being faster than random.)

    Why are 4k reads @ qd 1 so much slower than writes on Intel drives?

    Thanks in advance for any help to understand these issues.

    EDIT: According to Wiki:

    Some hard drives will improve in performance as the number of outstanding IO's (i.e. queue depth) increases. This is usually the result of more advanced controller logic on the drive performing command queuing and reordering commonly called either Tagged Command Queuing (TCQ) or Native Command Queuing (NCQ).
    Sounds like the reads/ writes are queued to be processed more effectively. I can understand that for a hdd but not for an ssd.
    Last edited by Ao1; 01-04-2010 at 07:16 AM.

  18. #18
    Xtreme Mentor
    Join Date
    Feb 2009
    Posts
    2,597
    Ok, now I think I'm beginning to understand why raid 0 does not appear faster than a single drive for desktop users. At qd 1 reads/writes are typically not faster when you go to raid 0, in fact they can even be slower.

    Desktop systems are mainly qd1 or less so the read/ write speeds @ qd 64 etc have nothing to do with it. Even at qd 10, which will only happen rarely the benefit of increased read/ writes is no big deal.

    For desktop it is predominantly all about low access performance at qd1. Sequential reads/ writes at ssd speeds don't mean a whole lot for desktop users. i.e read a 500MB file @ 500MB/s = 1 second, read a 500MB file @ 250MB/s = 2 seconds. No big deal.

    Am I on the wrong planet or does this make sense?

  19. #19
    SLC
    Join Date
    Oct 2004
    Location
    Ottawa, Canada
    Posts
    2,795
    What makes more sense is that we are just near the maximum of what extra storage speed can do for us. If QD1 was all that mattered than Acards would be near twice as fast as good SSDs and they are only a little quicker in real world stuff. For example a game takes 10 seconds to load... 7 seconds of that is likely CPU grunt work or just due to bad coding and 3 seconds is dependent on storage speed. You can double storage speed and shave off only 1.5seconds in this example... Comparing to HDDs, which are dozens of times slower kind of shows this as well.

  20. #20
    Xtreme Cruncher
    Join Date
    Dec 2008
    Location
    The Netherlands
    Posts
    896
    Quote Originally Posted by audienceofone View Post
    Ok, now I think I'm beginning to understand why raid 0 does not appear faster than a single drive for desktop users. At qd 1 reads/writes are typically not faster when you go to raid 0, in fact they can even be slower.

    Desktop systems are mainly qd1 or less so the read/ write speeds @ qd 64 etc have nothing to do with it. Even at qd 10, which will only happen rarely the benefit of increased read/ writes is no big deal.

    For desktop it is predominantly all about low access performance at qd1. Sequential reads/ writes at ssd speeds don't mean a whole lot for desktop users. i.e read a 500MB file @ 500MB/s = 1 second, read a 500MB file @ 250MB/s = 2 seconds. No big deal.

    Am I on the wrong planet or does this make sense?
    Without Native Command Queuing, a disk will only accept one command at a time. That means if the disk gets a read or write command, it will finish that command before it accepts a new command. Now Native Command Queuing allows the drive to accept multiple commands and put them in a queue and optimizes that queue, so it get the job done in the fastest way possible. Let's say the drive gets a write command to write 512 bytes of data. Without NCQ it would write it on one of the NAND chips through one the 10 channels in the X25-m. The other 9 channels wouldn't be doing anything in that case. With NCQ enabled, it could use channel #1 to process that write request, while channel #2 and #3 process a read request, while channel...etc

    I think you get the point. In old platter based HDD it also optimizes the queue, although in a different way, since a platter based HDD doesn't use different channels. I am not sure if NQC allows the drive to use 1 platter for one command and the other platter for another command (in case of a multi-platter based drive.), but what I do know is it works like this:


    "NCQ allows the drive itself to determine the optimal order in which to retrieve outstanding requests. This may, as here, allow the drive to fulfill all requests in fewer rotations and thus less time."

    Source: Wikipedia, http://en.wikipedia.org/wiki/Native_command_queuing

  21. #21
    Xtreme Mentor
    Join Date
    Feb 2009
    Posts
    2,597
    Ok, so in the diagram above NCQ is delivering the fastest route between 4 points thereby minimising access time. On an SSD it is organising the writes to minimise the rewrite penalty.
    But why do 4k reads @ qd1 suck so much in comparison to writes on Intel drives?

  22. #22
    Xtreme Mentor
    Join Date
    Feb 2009
    Posts
    2,597
    I found this quite informative because it puts context to queue depth relevance for desktop users:

    "But I use my computer more like a server, I multi-task loads!"

    "It isn’t uncommon for people to think that because they are a power-user, they make far more disk access requests than a typical PC user. While this may be true, queue depths still remain within the realms of desktop access patterns. Even if you scan for viruses while defragmenting your drive, while using Photoshop while streaming HD video while gaming and so on, queue depths will remain insufficient [below double digits] for command queuing to provide an overall increase in performance."

    The advice not to use NCQ for desktop use is based on hdd. It is not relevant for SSD, which will see a drop in performance no matter what the queue depth. (On an Intel drive anyway, not sure about others)

  23. #23
    Xtreme Guru
    Join Date
    Aug 2009
    Location
    Wichita, Ks
    Posts
    3,887
    the thing about ncq for the ssd is the fact that it does write consolidation. that should help with wear.
    intel shows drop in performance with ncq enabled?
    Last edited by Computurd; 01-05-2010 at 08:02 PM.
    "Lurking" Since 1977


    Jesus Saves, God Backs-Up
    *I come to the news section to ban people, not read complaints.*-[XC]Gomeler
    Don't believe Squish, his hardware does control him!

  24. #24
    Xtreme X.I.P.
    Join Date
    Apr 2008
    Location
    Norway
    Posts
    2,838
    NCQ on the Intels is what really makes them shine.

    I haven't tried disabling NCQ on the 9260 so I wouldn't know if the controller makes a difference.
    -
    Hardware:

  25. #25
    Xtreme Mentor
    Join Date
    Feb 2009
    Posts
    2,597
    The write latency goes up without NCQ but it is the 4k reads at qd64 that really get hit. Without NCQ the read performance at qd64 stays around the same as qd1. (As can be seen here, which I found randomly during a search)

    I still can't work out why reads get so much better at higher qd's. (Not to say they are good at qd1) It must be something to do with NCQ but how that works I have no idea.

Page 1 of 6 1234 ... LastLast

Bookmarks

Bookmarks

Posting Permissions

  • You may not post new threads
  • You may not post replies
  • You may not post attachments
  • You may not edit your posts
  •