

That looks like a fantastic study, however, I can't make any sense out of it. I see a lot of data but how am I supposed to know what it means?Originally Posted by F@32

Pardon my ignorance


That looks like a fantastic study, however, I can't make any sense out of it. I see a lot of data but how am I supposed to know what it means?
Pardon my ignorance
Maybe Anand uses 1 worker and you use 8 workers?
Maybe someone from the himon thread could step in here.
You can't just say "times have changed" and expect that to make your new sillyness be factual. In the past there it's been guessed that 4k file sizes were the most important, however now there is ample evidence that this is the case. Generally speaking according to looking at data for both games and utility applications the majority of file transaction seem to be 4k (over 80% or something). This is not opinion or guesswork this is analyzing real world data.
There are plenty of usage scenarios where you'd like to have large sequential transfers, but it's all relative. When you compare the total amount of transactions going on the amount of them where sequential is important is very small, again, according to analyzed data of real world usage.
If you spend every moment dealing with huge video files or raw images or you're in some other large file size needing profession of course sequential is important. It's certainly not so important to the average user who copies a movie (or a few) or an album (or a few) now and then.
Opinion now follows:
To whoever it was that put Boot as their #1 priority for SSD I can only say I'm still surprised every time I see this as I believe it's an absurd metric to judge storage. Boot time matters even less than sequential! You certainly spend more time copying large files than you do booting. What are you gaining on boot time? A few seconds? 15 seconds maybe on the fastest possible boot speed increase? You should want your computer to fly at the most important time, when you're actually using it!
I'm glad I didn't go with a raid card or even onboard raid because tomorrow morning when I turn on my computer it's going to get to windows 12 seconds faster!
Good grief Charlie Brown.
slowpoke:
mm ascension
gigabyte x58a-ud7
980x@4.4ghz (29x152) 1.392 vcore 24/7
corsair dominator gt 6gb 1824mhz 7-7-7-19
2xEVGA GTX TITAN
os: Crucial C300 256GB 3R0 on Intel ICH10R
storage: samsung 2tb f3
cooling:
loop1: mcp350>pa120.4>ek supreme hf
loop2: mcp355>2xpa120.3>>ek nb/sb
22x scythe s-flex "F"
Dang I can get 2 x 128GB Crucial C300 now to my door for $400. I also just got a auto notify from the egg on the OCZ Vertex 3 120GB but only 1 per customer so I did not pull the trigger. I may just wait for the Vertex 3 240GB to come available on the egg in a couple of days.
CPU: Intel Core i7-4770K 4.8GHz
MOBO: GIGABYTE GA-G1.Sniper M5 MATX 1150
MEMORY: G.SKILL Trident X 8GB 2400MHz 9-11-11-31 1T
GPU: 2 x eVGA GTX 780 SC
SOUND KRK Rokit 5 Limited Edition White Studio Monitors
SSD: 4 x Samsung 128GB Pro's Raid 0
PSU: SeaSonic Platinum 1000W
COOLING: 2 x Alphacool NexXxoS UT60 Full Copper 420mm 6 x Swiftech Helix 140mm Fans
CASE: Lian Li PC-C32B TECH STATION MOD build log coming soon
MONITOR: ASUS VG278HE Black 27" 149Hz
O.S: Windows 7 Pro x64
The 4K Read Speed is 30MB/s only in R0 but the Write Speed is 339MB/s, does it is only a Write Cache Speed?
This is with Write Cache enabled in Intel RAID and Windows Write Back Caching. What controller does is write combining and writing sequential blocks versus random. Cache is not huge on C300, I believe it's 128/256MB. So it's not purely cache testing.
Ao1, feel free to step in here buddy.
Here's what it means: For sample of games tested, read operations are mostly dealing with 4KB files sizes. See below.
Overall this is I think is the best summary that shows weights by transfer size and QD depth:
72% of 4K random, and 85% of QD1 operations is what is the most important. This was constructed based on information from JEDEC as well as testing and observations of real applications usage by Ao1, Anvil, Tilt and others.
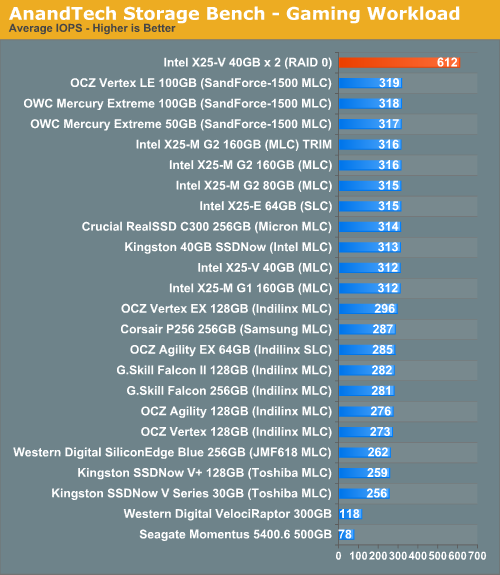
Interestingly in this article http://www.anandtech.com/show/3618/i...m-g2-for-250/5 Anand says:
But this is a benchmark and I'm not sure what he means "The average queue depth is 7.76 IOs"? QD7? Also would be nice to see loading times. As lowfat and One_Hertz will confirm even ioDrive and ioXtreme do not help game loading times over single X25-M. Anything better than that is bottlenecked by CPU.The gaming workload is made up of 75,206 read operations and only 4,592 write operations. Only 20% of the accesses are 4KB in size, nearly 40% are 64KB and 20% are 32KB. A whopping 69% of the IOs are sequential, meaning this is predominantly a sequential read benchmark. The average queue depth is 7.76 IOs.
Last edited by F@32; 04-07-2011 at 10:24 AM.
Sony KDL40 // ASRock P67 Extreme4 1.40 // Core i5 2500K //
G.Skill Ripjaws 1600 4x2Gb // HD6950 2GB // Intel Gigabit CT PCIe //
M-Audio Delta 2496 // Crucial-M4 128Gb // Hitachi 2TB // TRUE-120 //
Antec Quattro 850W // Antec 1200 // Win7 64 bit
Here is mine with 4x256gbc300 on ich10. Many moons ago. Good times. I'm sure the difference from doorules is newer drivers and stripe size. The ich is still quite a beast.
slowpoke:
mm ascension
gigabyte x58a-ud7
980x@4.4ghz (29x152) 1.392 vcore 24/7
corsair dominator gt 6gb 1824mhz 7-7-7-19
2xEVGA GTX TITAN
os: Crucial C300 256GB 3R0 on Intel ICH10R
storage: samsung 2tb f3
cooling:
loop1: mcp350>pa120.4>ek supreme hf
loop2: mcp355>2xpa120.3>>ek nb/sb
22x scythe s-flex "F"
.................
i have ordered a vertex3 120gb......
In post #105 I compare the (full) boot process between HDD, SSD and SSD Raid 0 using the same OS image.
The busy time periods show the time saved between the different devices:
SSD Raid 0 was the least busy at 6.59 seconds.
SSD came in at 8.54 seconds. (+ 1.96 seconds)
HDD came in at 1min 58 seconds (+111.41 seconds)
So, by going SSD Raid 0 I save 1.96 seconds over a single SSD, but I save nearly two minutes with a single SSD over a HDD.
HDD performance (unlike SSD) would drop over time as the drive became fragmented, so over time the saving would increase.
In post #341 I look at game loading:
Read xfers
92,623 read I/O operations; total 1,772,378,112 bytes read
. Largest single I/O xfer size = 28.24 MiB (1 occurrence)
. Smallest single I/O xfer size = 512 bytes (305 occurrences).
Write xfers
6,697 write I/O operations; total 113,272,832 bytes written
. Largest single I/O xfer size = 2.75MiB (2 occurrences)
. Smallest single I/O xfer size = 512 bytes (245 occurrences).
Highest read IOP Count xfer size = 4kB (39,023 occurrences).
Highest write IOP Count xfer size = 4kB (5,018 occurrences).
The largest single I/O xfer size = 28.24 MiB, which occurred once. Compare that to 39,023 4kB xfers.
Maybe I'm not 100% right on this but the problem I see with "real life" benchmarks is that whilst they might utilise the right xfers sizes and mix of reads and write they then go on to apply the load over an extended timeframe. From what I have been able to observe at the device level there are bursts of activity followed by inactivity. (And mostly inactivity, compared to I/O activity in the file system). The SSD therefore has time to recover in typical use. In the benchmark the SSD is not given time to recover, which might affect some SSD's more than others.
If you then choose to apply the benchmark load at QD3 you are only further removing the outcome from what happens in real life. I'd like to know exactly what Anandtech were monitoring that resulted in them deciding that QD 3 was more relevant than QD1. Outside of benchmarks my Avg Q/D is 1, even when multi tasking.
You need to look at QD3 and above however to start seeing real differences between SSD brands. @ QD1 the differences start to melt away.
I have only monitored Black Ops in depth. I've seen similar loads with a couple of other games, but I'd guess other games might load very differently. It would be great if Anand could say which game they used and share the metrics.
that boot time is insane
so why does a real boot not take 8 seconds?
also when i was doing some tests on my own, when i was at a low cpu speed (6 cores at 1200mhz) i noticed cpu activity was higher, and lasted much longer than my defualt speeds, as if apps were still loading and needed some decent processing power. i doubt its related to my SSD directly, but more like just tasks running
2500k @ 4900mhz - Asus Maxiums IV Gene Z - Swiftech Apogee LP
GTX 680 @ +170 (1267mhz) / +300 (3305mhz) - EK 680 FC EN/Acteal
Swiftech MCR320 Drive @ 1300rpms - 3x GT 1850s @ 1150rpms
XS Build Log for: My Latest Custom Case
haha, show the evidence, but not my own findings. Funny, but get off your high horse.
The attached pic from Anandtech is one example, I have loads of others.
The proof that 4K random is not the be all and end all.
Take one SATA 6Gbps SSD the Plextor PX-256M2S. It's an Intel 510 / Corsair P3 clone. All 3 of these SSDs are completely spanked by the SF-1200 based SSDs, the C300, and the Intel G2/G3 SSDs for random read/write performance.
I have reviewed the Plextor drive, and many sites have reviewed the Intel 510.
If 4K is the real benchmark of real world performance, then why does the Plextor PX-256M2S and the Intel 510 spank the SF-1200, C300, and Intel G2/G3 in the real world tests run by myself, and the same again in the Anandtech storage bench?
My results.
Anandtech Intel 510 (please see the storage bench pages in that review).
If all the metrics say 4K for real world, does it not strike you as odd that two SSDs with mediocre 4K performance but excellent sequential performance spanks the SSDs which are the known 4K front runners?
@ F@32
There is nothing radical about the analyzer, or the traces used for measuring, it simply measures what is put through it.
I write my articles for the MyCE members, no one else. They happen to be almost exclusively "mainstream consumer" desktop users, who actually do a lot of video, audio, and picture editing/recoding/transcoding. There are over half a million members, and i'm not going to argue with them that their usage pattern is, odd.
So to answer another question. Yes the transfer size of the files is on the large side for some of the "reality tests". The multitasking test, I would say is much the same sort of tests that anyone else might run, and not to far off what Anandtech run.
Review PC
AsRock Z68 Extreme 4 | 2600K @4.8GHz 1.35V | 2x 2GB GEIL Ultraline 2133MHz @ 1600Mhz 7.7.7.24 | ATi 5770 Vapor X | OCZ RevoDrive X2 240GB | OCZ Vertex 3 240GB | RealSSD C300 128GB | OCZ Vertex 2 100GB | 2x Samsung F3 1TB | Enermax Liberty 620W | Antec 900

The QD of a real workload would depend on the device it is being ran on. If Anand ran it on an HDD first, it would sort of make sense. HDD can't keep up = QD rises. If he ran it on an SSD then QD would probably be 1ish. I surely hope QD7 is not being forced onto the SSDs by his benchmark, as that would make it useless.
Actually, Iodrive helps a bit with loading times. 1s decrease taking me from 7.5sec to 6.5sec in l4d. 4x X25-E in R0 is exactly the same 7.5s as a single X25-M though. Indilinx is slower at about 8s.
Last edited by One_Hertz; 04-07-2011 at 12:33 PM.
If you look at the Idle/ Busy time percentage in the boot post they are almost inverse between HDD & SSD. (HDD 1.6%, SSD 92.9% & SSD R0 94.5%) That would seem to imply that the SDD ends up waiting for the system to process data before data for the next task is requested.
If you look at the fast IOPs percentages they are also almost inverse between HDD and SSD. 0.9% HDD, 98.5% SSD & 99% with SSD R0.
That is what I was wondering. For writes I can often see an Avg QD2, but for reads the Avg is QD 1, although the max QD can get up to ~6 or 8.
Just wanted to thank F@32, Ao1 and Wendy for argumenting and not only saying "Shut up, you're saying bull".
You made me (us ?) learn many things there
Sorry for my bad english, I'm trying to improve it

I do not doubt what you (or others) have observed. Metrics will always vary from user to user.
If that Anandtech heavy load is representative of real life you might be forgiven for thinking that an X25-E is going to be significantly faster than an X25-M. I have used the X25-E is R0 and as a single drive. I can't say I noticed any real life differences when I switched to a single X25-M. If you look at that graph I can understand why that might seem surprising.
I've got 2 x X25-M's now, but I don't bother with R0. I use one for the OS and one for static data. If I thought raid 0 was faster I would use it.
Throughput above a single drive is of no use to me. That is not to say however that it might be useful to someone else. I only share what I have experienced.
A few initial tests of my Vertex 3 240GB
as-compr-bench OCZ-VERTEX3 4.8.2011 7-09-03 PM.png
For some reason 4K QD1 was really low on the first run
as-ssd-bench OCZ-VERTEX3 4.8.2011 7-05-52 PM.png
The second run was way better wrt 4K QD1, need to check these results on the 9211.
2nd run
as-ssd-bench OCZ-VERTEX3 4.8.2011 7-12-40 PM.png as-ssd-bench OCZ-VERTEX3 4.8.2011 7-13-05 PM.png
All these tests are performed using one of the 6Gb/s Intel P67 ports, PCH/Asus P8P67.
Will be running a few iometer test shortly.
-
Hardware:
oh man that is exciting! cant wait to hear your impressions of this drive anvilinteresting the latency...when you try on the 9211 in passthrough that will be very interesting as well. im sure you will be peppering it with 8k tests and that would be very interesting as well!
"Lurking" Since 1977

Jesus Saves, God Backs-Up *I come to the news section to ban people, not read complaints.*-[XC]GomelerDon't believe Squish, his hardware does control him!
I've done a lot of tests but I need to rerun a few of the tests to make sure that the figures are correct.
I'll be comparing the V3 to the V2 of the same capacity, some of the results points to the V2 being a better performer in a few cases.
The 9211 and the V3 do not talk, that is, it shows up in the list of attached devices/drives but I just can't get to it as a passthrough drive.
I even upgraded bios/firmware on the 9211 but to no avail, other drives work just fine so there is something going on with the V3 and the 9211.
The good news is that it plays just fine with the 9265
Anyways, here are a few more results from just playing with standard benchmarks.
8KB clustersize, still on the Asus P8P67
as-ssd-bench OCZ-VERTEX3 4.8.2011 11-53-03 PM_8KB_cs.png
Could be a fluke, will rerun later.
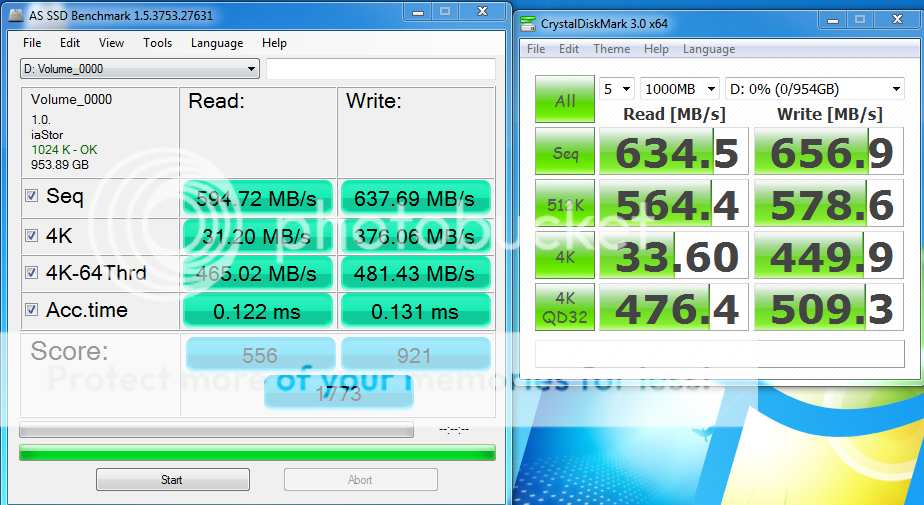
CDM shows another view of 4K performance, as usual
Pretty strong results as this is "incompressible" data.
CDM_1GB_1st_run.JPG
I'll get back with a few results from the ICH and later today from the AMD rig.
X58A-UD7 - ICH10R 3Gb/s
as-ssd-bench OCZ-VERTEX3 4.8.2011 9-30-20 PM.png
Last edited by Anvil; 04-09-2011 at 02:28 AM.
-
Hardware:
A few iometer results
compressible data vs incompressible
iometer_v3_rr_4k_128kb_compressible.png iometer_v3_rr_4k_128kb_incompressible.png
-
Hardware:
@anvil--nice chart! nice to see that the small file performance remains roughly unaffected by the random incompressible data. as a matter of fact it looks the same until you get up to 32k for the most part. that is nice
interesting thing here. finally got around to reading anands review on the 120 vertex 3. interesting how he rewrites his test bench totally, and all of a sudden the V3 is tops in everything. Yet he then uses his old testbench as comparison, and the M4 wins all of those.
Last edited by Computurd; 04-09-2011 at 11:04 AM.
"Lurking" Since 1977
Jesus Saves, God Backs-Up *I come to the news section to ban people, not read complaints.*-[XC]GomelerDon't believe Squish, his hardware does control him!
Yep - which "real world" is "real world" haha...
MAIN: 4770K 4.6 | Max VI Hero | 16GB 2400/C10 | H110 | 2 GTX670 FTW SLi | 2 840 Pro 256 R0 | SB Z | 750D | AX1200 | 305T | 8.1x64
HTPC: 4670K 4.4 | Max VI Gene | 8GB 2133/C9 | NH-L9I | HD6450 | 840 Pro 128 | 2TB Red | GD05 | SSR-550RM | 70" | 8.1x64
MEDIA: 4670K 4.4 | Gryphon | 8GB 1866/C9 | VX Black | HD4600 | 840 Pro 128 | 4 F4 HD204UI R5 | 550D | SSR-550RM | 245BW | 8.1x64
Vertex 3 120gb 2xr0 random read 4k aligned Areca , 12gb testfile no readahead 8k clustersize
8k clustersize + 4k clustersize.
8k gives 10Mb/s more linear read speed in aida 1MB test. :p
Last edited by Nizzen; 04-09-2011 at 02:00 PM.
is there any way we could see the difference between 8k cluster and default nizzen?
"Lurking" Since 1977
Jesus Saves, God Backs-Up *I come to the news section to ban people, not read complaints.*-[XC]GomelerDon't believe Squish, his hardware does control him!
 Posting Permissions


 Reply With Quote
 ttp://[/IMG]


Bookmarks