Page 1 of 16 123411 ... LastLast
Results 1 to 25 of 376

Thread: hIOmon SSD Performance Monitor - Understanding desktop usage patterns.

  1. #1
    Xtreme Mentor
    Join Date
    Feb 2009
    Posts
    2,597

    hIOmon SSD Performance Monitor - Understanding desktop usage patterns.

    Thread Summary

    The objective of this thread was to understand how a SSD performed under typical desktop applications. HDD's are perceived as being the bottleneck in the system, so it is logical to assume that a faster storage system would have the potential to significantly improve overall system performance.

    Enter the SSD.

    Is storage still the bottleneck? What types of demand are put on the SSD and what are the performance characteristics of the SSD that matter? Finally how much of those key performance characteristics are being utilised?

    The tools

    hIOmon provides a sophisticated platform that can observe the following:

    1. Observe I/O operations in action at three different critical points within the OS I/O stack: the file system level (essentially the application/process level), the physical volume level, and the physical device level. This can help provide for a more complete, overall picture of what actually occurs during I/O operation processing.

    2. Selectively observe I/O operations at one or more of these three levels.

    This can help identify those particular I/O operations that are, for instance, germane to only a single level, e.g., I/O operations that are satisfied directly by the use of the system file cache and thus are effectively limited to the file system level only, I/O operations that are issued by applications/programs directly to a device at the physical device level and without direct interaction with the file system level, etc.

    3. Optionally observe I/O operations concurrently at two or more levels, and moreover correlating I/O operations as they traverse the different levels.

    To help anyone interested in doing their own monitoring a fully functional trial can be downloaded here and a quick set up guide to get up and running quickly can be found in post #187

    The set up (Unless otherwise stated).

    Asus Rampage Extreme. ICH9. QX6850. 8GB RAM. Asus Xonar DX2.4870x2. 160GB X25-M x2 and 1 160GB Seagate Barracuda 7200

    Summary of activities monitored

    The operating system was Win 7/64. An image was made to compare performance between different storage configurations within the same system to try and provide comparable results. Typical applications included games, office, web browsing, WMP, Power DVD, Traktor and Photoshop.

    OS I/O Stack

    An example of I/O activity at each of the three levels that hIOmon can monitor can be found in Post # 329 and Post # 330

    A summary of key device level and logical disk I/O activity monitored during game play with Black Ops SP in post #329 is provided below:

    Device Level Reads
    • Data transferred = ~406MB (Incurred over 30 minutes of game play).
    • Total I/O's = 16,216
    • Max IOPs = 22.7.
    • FastIOPS 97.4 % (less than one millisecond).
    • Min xfer size = 1,024. Average xfer size = 26,317. Max xfer size = 262,144.
    • Min response time = 0.0416ms. Avg response time = 0.2179ms. Max response time = 10.4449ms
    • Maximum data transfer rate for a single I/O operation. = 268.59MB/s. (If done in less than one millisecond MB/s is technically "inflated").

    File/ Logical Disk Level Reads
    • Data transferred = 2.35GB
    • Total I/O's = 193,016
    • Max IOPs = 152.9
    • FastIOPS 95.3 % (less than one millisecond).
    • Min xfer size = 0. Average xfer size = 13,662. Max xfer size = 262,144.
    • Min response time = 0.00416ms. Avg response time = 0.0584ms. Max response time = 10.5207ms
    • Maximum data transfer rate for a single I/O operation. = 2,801.833MB/s.

    Device Level I/O Transfers.

    I/O xfers at the device level post #336
    Metrics from 3 different scenarios were captured.

    • Black OPS Single Player - Without AV
    • Black Ops Multi Player - Without AV
    • OS with just IE, Word, Excel & Live Mail - with AV

    OS with just IE, Word, Excel & Live Mail

    Read xfers

    31,299 read I/O operations; total 674,738,176 bytes read
    . Largest single I/O xfer size = 1.14MiB (1 occurrence)
    . Smallest single I/O xfer size = 512 bytes (303 occurrences).

    Write xfers

    8,645 write I/O operations; total 98,129,920 bytes written
    . Largest single I/O xfer size = 2MiB (2 occurrences)
    . Smallest single I/O xfer size = 512 bytes (352 occurrences).

    Highest read IOP Count xfer size = 32kB* (10,471 occurrences).
    Highest write IOP Count xfer size = 4kB (6,134 occurrences).

    *The high occurrences of 32kB xfers are possibly due to AV activity.

    Black Ops Single Player

    Read xfers

    92,623 read I/O operations; total 1,772,378,112 bytes read
    . Largest single I/O xfer size = 2.75 MiB (1 occurrence)
    . Smallest single I/O xfer size = 512 bytes (305 occurrences).

    Write xfers

    6,697 write I/O operations; total 113,272,832 bytes written
    . Largest single I/O xfer size = 2.75MiB (2 occurrences)
    . Smallest single I/O xfer size = 512 bytes (245 occurrences).

    Highest read IOP Count xfer size = 4kB (39,023 occurrences).
    Highest write IOP Count xfer size = 4kB (5,018 occurrences).


    Black Ops Multi Player

    Read xfers

    2,648 read I/O operations; total 318,201,856 bytes read
    . Largest single I/O xfer size = 0.88 MiB (1 occurrence)
    . Smallest single I/O xfer size = 512 bytes (12 occurrences).

    Write xfers

    6,299 write I/O operations; total 55,623,168 bytes written
    . Largest single I/O xfer size = 0.88 MiB (1 occurrences)
    . Smallest single I/O xfer size = 512 bytes (167 occurrences).

    Highest read IOP Count xfer size = 72kB (1,010 occurrences).
    Highest write IOP Count xfer size = 4kB (4,027 occurrences).


    Boot up.

    The bootup process involves three stages: (Please see post # 255 for more details)
    1. Hardware enumeration to enable the OS loader to take control
    2. Main Boot Path Time - Essential services and drivers to load desktop
    3. Post boot time - Drivers, processes and applications that aren’t critical for user interaction and can be loaded with low-priority I/O that always gives preference to user-initiated actions that execute using Normal I/O priority.

    By default the hIOmon software is configured to automatically begin monitoring when the services are started during stage three. There is also an option, however, whereby the hIOmon software can be configured so that it instead begins monitoring very early within the "Main Boot Path Time" (stage 2). Please see post #32 for details


    The amount of data loading during the boot process can vary significantly depending on the type of applications that have been installed. The time it takes to fully load can also vary significantly depending on user-initiated actions, automatic updates and AV activity.

    During boot all the data has to initially be read from the physical disk.

    Typical read transfer sizes during boot can be found in post #190. The vast amount of read transfer sizes are 6,000 bytes and below. Only 16 read transfer sizes were above 1MB and the largest read transfer sizes was 11MB.

    The boot process was monitored on three different storage systems. HDD, SSD & SSD Raid 0. (Please see post # 105).

    Key storage load metrics (Approximated)
    • 95% random reads and writes.
    • 20,000 I/O operations overall.
    • Overall average IOPs = 190
    • Overall average transfer size 20,000 bytes (19KB)
    • Total read data transferred 420MB
    • Total write data transferred 24MB

    Key storage performance metrics
    • HDD Percentage of fast read/ write IOPs performed = 1.2%
    • SSD Percentage of fast read/ write IOPs performed = 98.3%
    • SSD Raid 0 Percentage of fast read/ write IOPs performed = 98.9%

    • HDD busy time = 1min 58s
    • SSD busy time = 8.54s
    • SSD Raid 0 time = 6.59s

    • HDD average response time = 53.40ms
    • SSD average response time = 0.49ms
    • SSD Raid 0 average response time = 0.33ms

    Whilst the performance difference between HDD & SSD is significant the difference between a single SSD and SSD Raid 0 is marginal.

    Anvils post # 118 provides a comparison with no apps installed.

    i7 920 UD7, 2R0 C300 64GB

    Key storage load metrics
    • 88.7% random reads and writes.
    • 12,251 I/O operations overall.
    • Overall average transfer size 17,546 bytes
    • Total read data transferred 190MB
    • Total write data transferred 14MB

    Key storage performance metrics
    • Percentage of fast read/ write IOPs performed 96.4%
    • Busy time 2.62s
    • Average response time 0.32ms

    AMD 1090T - Samsung F3 HDD

    Key storage load metrics
    • 78.9% random reads and writes.
    • 7,179 I/O operations overall.
    • Overall average transfer size 17,267 bytes
    • Total read data transferred 98MB
    • Total write data transferred 20MB

    Key storage performance metrics
    • Percentage of fast read/ write IOPs performed 61.3%
    • Busy time 12.57s
    • Average response time 4.47ms

    Whilst the total read data transferred differed significantly between the different storage systems that were monitored the random read percentages were all comparable. The overall average transfer sizes were also comparable.

    Anvils Samsung F3 was lot faster than the HDD I monitored (Seagate Barracuda). New installs on HDD always seem quite fast at first, but they soon slow down as more data gets loaded over time and the drive becomes fragmented.

    The impact of file cache.

    After boot up frequently used data can be held in memory-resident file cache to speed up access that would otherwise be dependent on a read form the physical device. Access to files that are resident in memory is significantly faster than having to retrieve the files from the physical disk. This process helps mask the poor random small file access performance associated with HDD.

    The impact of file cache can be found in post #223 and post #224. In post #218 it is evident that none of the small file transfers occurred on the physical disk.

    An observable impact of cache with a large file transfer can be found in post #222. Better clarification of the observations can be found in post #223 & post #234.

    For information on the impact of file cache with typical use a comparison of the top 10 read and write data transfers between those monitored on the physical device and those monitored overall can be found in post # 241 (reads) and post # 242 (writes).

    • System top read data transfer size = 24,877 occurrences of 40 bytes
    • Physical device top read data transfer size = 1,079 occurrences of 4,096 bytes
    • System top write data transfer size = 7,228 occurrences of 152 bytes
    • Physical device top write data transfer size = 450 occurrences of 512 bytes

    For both reads and writes that occur on the physical device 0.5KB and 4KB file transfers dominate.

    The percentage difference between overall writes and reads can be found in post # 244

    • Overall system reads = 93%
    • Physical device reads = 88%

    The difference between total data transferred between overall data transfer and data transferred on the physical device can be found in post # 243.

    Gaming Performance

    Call Of Duty Black Ops - Single Player

    Please see post #159 for graphs showing the data summarised below.

    • Maximum random sequential read speed = 97.92MB/s
    • Maximum random read speed = 26.33MB/s
    • Maximum random access IOP count = 13,750
    • Maximum Sequential Access IOP Count = 3,275
    • Fast Read IOP count = 98%
    • Average read queue depth = 1
    • Maximum read queue depth = 5

    Call of Duty Black Ops Multi Player

    Please see post #165 for graphs showing the data summarised below.

    • Maximum sequential read speed = 121.11MB/s
    • Maximum random read speed = 10.63MB/s
    • Maximum random access IOP count = 11,140
    • Maximum Sequential Access IOP Count = 10,379
    • Fast Read IOP count = 98%
    • Average read queue depth = 1
    • Maximum read queue depth = 4

    For a comparison of key performance metrics between SSD & HDD whilst playing Black ops please see post #48

    In this post the impact of cached files is observed by reloading the same map in multiplayer mode. The first load incurred ~60% of the total reads. The map had to be reloaded a further 9 times to get the 40% balance of reads.

    Windows was able to satisfy a high percentage of I/O's specifically related to the Black Ops folder in cache, regardless of the storage medium

    • SSD without FancyCache = 86%
    • HDD without FancyCache = 85%

    HDD was much slower at loading the first level but after that it was hard to tell the difference between SSD due the amount of I/O being served in cache.


    Page File

    The purpose of a page file is described in Wiki as:

    [I]"In computer operating systems, paging is one of the memory-management schemes by which a computer can store and retrieve data from secondary storage for use in main memory. In the paging memory-management scheme, the operating system retrieves data from secondary storage in same-size blocks called pages. The main advantage of paging is that it allows the physical address space of a process to be noncontiguous. Before the time paging was used, systems had to fit whole programs into storage contiguously, which caused various storage and fragmentation problems.
    Paging is an important part of virtual memory implementation in most contemporary general-purpose operating systems, allowing them to use disk storage for data that does not fit into physical random-access memory (RAM)".


    According to a MSDN blog

    ...."most pagefile operations are small random reads or larger sequential writes, both of which are types of operations that SSDs handle well.

    In looking at telemetry data from thousands of traces and focusing on pagefile reads and writes, we find that

    • Pagefile.sys reads outnumber pagefile.sys writes by about 40 to 1,
    • Pagefile.sys read sizes are typically quite small, with 67% less than or equal to 4 KB, and 88% less than 16 KB.
    • Pagefile.sys writes are relatively large, with 62% greater than or equal to 128 KB and 45% being exactly 1 MB in size.

    In fact, given typical pagefile reference patterns and the favorable performance characteristics SSDs have on those patterns, there are few files better than the pagefile to place on an SSD."


    In post #160 page file was activity monitored. The system had 8GB of RAM.

    Key transfer metrics
    • Total read data transferred = 90.20MB
    • Total write data transferred = 280.81MB
    • Max read data transfer = 37MB
    • Max write data transfer = 118MB

    Photoshop generated large writes, which did not appear to be read back. If the large writes generated by Photoshop are excluded the page file activity was representative of the telemetry data collected by MS.

    For a comparison between boot up with the page file enabled and disabled please see post #92. With the page file disabled response times improved along with the percentage of fast IOPs counts.

    Sequential speeds & multitasking

    Sequential reads of typical apps can be found in post # 237
    • Play DVD = 12.67 MB/s
    • Rip DVD = 2.76 MB/s
    • Quick MS Essential AV scan = 30.71 MB/s
    • Zip a file = 6.34 MB/s
    • Black Op Single Player = 96.30 MB/s
    • Create HD video = 15.68 MB/s
    • Copy 600mb AVI file = 252.70 MB/s
    • Copy 1.3GB folder with various sized jpegs = 251.19 MB/s

    An attempt to run multiple tasks to achieve the max sequential read speed of the SSD resulted in the CPU maxing out. (Please see post # 5)

    For a comparison between multi tasking sequential read speeds obtained between SSD and HDD please see post #47

    • HDD Black Ops = 67.37MB/s
    • SSD Black Ops = 81.70MB/s

    • HDD Photoshop = 14.09MB/s
    • SSD Photoshop = 28.31MB/s

    • HDD MS Essentials = 11.36MB/s
    • SSD MS Essentials = 29.16MB/s

    • HDD PowerDVD = 11.90 MB/s
    • SSD PowerDVD = 16.26MB/s
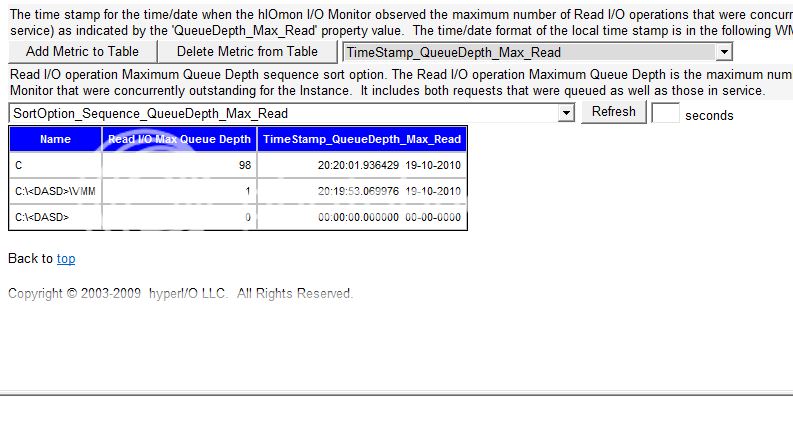
    Queue Depths

    Queue depths under different loads are summarised in post # 8
    • Avg Read QD heavy multi tasking - 1.057
    • Max Read QD heavy multi tasking - 4
    • Avg Read QD light multi tasking - 1.024
    • Max Read QD light multi tasking - 35
    • Black Ops single player read = 1.087
    • Black Ops single player write = 2.015

    A summary of 2 days worth of data can be found in post # 24
    • Max average QD = 1.418
    • Max read QD = 18
    • Max average write QD = 2.431
    • Max write QD = 70

    Intriguingly read QD's were generally lower on HDD when compared to SSD. Conversely write QDs were generally higher on HDD. Please see post # 47

    Significantly higher queue depths were only observable when benchmarks were monitored.

    IOPs Work in progress

    IOPs can be approximated using the following formula:
    • Queue depth*(1/latency in ms) = IOPs

    MB/s can be approximated using the following formula:
    • BytesPerSec = IOPS * Transfer size in bytes

    IOP capability is therfore linked to three key variables:
    • Transfer size
    • Queue depth
    • Latency

    Average queue read depths, as observed above, are typically just over one. Most of the transfer sizes are 4,096 bytes or less. If these parameters are taken as a given the impact of latency becomes critical to IOP performance.

    Based on the average latency of 0.01ms
    • Queue depth 1 x (1/0.00001) = 100,000 IOPS
    Based on the average latency of 0.1ms
    • Queue depth 1 x (1/0.0001) = 10,000 IOPS
    Based on the average latency of 0.2ms
    • Queue depth 1 x (1/0.0002) = 5,000 IOPS
    Based on the average latency of 0.3ms
    • Queue depth 1 x (1/0.0003) = 3,333 IOPS
    Based on the average latency of 0.49ms
    • Queue depth 1 x (1/0.00049) = 2,040 IOPS

    Overall average IOPs rates observed (Please see post #94)

    • Boot up = 190 IOPs
    • Multi tasking = 70 IOPs
    • PCMark HDD Suite = 62 IOPs
    • VMWare = 130 IOPs
    • ATTO = 3,552 IOPS

    It seems that IOP capability is significantly underutilised, which is a shame as it is perhaps the most significant performance advancement in SSD development.

    According to AS SSD Benchmark:

    • X25-M 4k read random speed at QD 1 = 21MB/s
    • X25-M 4K random read IOPs at QD1 = 5,322 IOPs
    • X25-M read access time = 0.077ms
    • X25-M 4k write random speed at QD 1 = 45.17MB/s
    • X25-M 4k write IOPS at QD1 = 11,563 IOPs
    • X25-M write access time = 0.097ms
    • X25-M sequential reads = 251MB/s
    • X25-M Sequential writes - 103MB/s

    • Raptor 4K read random speed at QD 1 = 0.76MB/s
    • Raptor 4K random read IOPs at QD1 = 195 IOPs
    • Raptor read access time = 8.408ms
    • Raptor 4K random write speed at QD 1 = 1.48MB/s
    • Raptor 4K random write IOPS at QD1 = 378 IOPs
    • Raptor write access time = 2.677ms
    • Raptor sequential reads = 77.54MB/s
    • Raptor Sequential writes - 56.19MB/s

    • OCZ Core 4K read random speed at QD 1 = 7.07 MB/s
    • OCZ Core 4K random read IOPs at QD1 = 2,293 IOPs (Estimated)
    • OCZ Core access time = 0.436ms
    • OCZ Core 4K random write speed at QD 1 = 1.88 MB/s
    • OCZ Core 4K random write IOPS at QD1 = 400 IOPs (Estimated)
    • OCZ Core access time = 2.496ms
    • OCZ Core sequential reads = 208.44 MB/s
    • OCZ Core sequential writes - 120.44 MB/s

    If Queue depth*(1/latency in ms) = IOPs
    • OCZ Core - Queue depth 1 x (1/0.002496) = Write 400 IOPs
    • Raptor - Queue depth 1 x (1/0.002677) = Write 373 IOPs
    • X25-M - Queue depth 1 x (1/0.000097) = Write 10,309 IOPs

    400 4K write IOPs is more than what was observed for typical use yet the OCZ Core would appear to stutter under light load.

    Native Command Queuing (NCQ)

    Intel made a post to describe the benefit of NCQ.

    "AHCI is a hardware mechanism that allows software to communicate with SATA drives. To make that transaction smoother, SATA devices were initially designed to handle legacy ATA commands so they could look and act like PATA devices. That is why many motherboards have “legacy” or IDE modes for SATA devices – in that case users are not required to provide additional drivers during OS installation. However, Windows 7 ships with AHCI drivers built in, so soon this mode will no longer be necessary.
    But this begs the question: what features does AHCI mode enable? The answer isn't simple, but one of the bigger advantages is NCQ, or native command queuing.
    NCQ is a technology that allows hard drives to internally optimize the order of the commands they receive in order to increase their performance. In an SSD everything is different. There is no need to optimize the command queue, but the result of enabling NCQ is the same – there is a performance increase. In brief, NCQ in an Intel SSD enables concurrency in the drive so that up to 32 commands can be executed in parallel.
    Also take into consideration that the speed of the processor and the RAM also the amount of it will affect the performance of the Solid State Drive."


    With NCQ enabled benchmarks show a significant increases in 4k reads/ writes @QD 32.

    The impact NCQ on large file transfers is monitored in post #317. Here a performance increase can also be seen.

    TRIM

    Information on TRIM metrics that hIOmon can observe can be found here

    An example of the TRIM related IO activity can be found in post # 148. An explanation of what is being observed can be found in post # 149.

    In post # 185 Anvil was able to observe TRIM related IO activity and establish that TRIM was working in a software Raid 0 configuration.

    In post # 131 Anvil was able to observe a big increase in the maximum response time due to a TRIM operation. A further explanation on this observation can be found in post # 134.

    A separate thread on verifying TRIM functionality can be found here.


    I have tried to provide accurate and relevant data in this summary. Please let me know if you see any mistakes or omissions.

    A special thanks to overthere for all his help and assistance and for a great piece of software. Thanks also to Anvil for providing comparative data and all other posters that have helped along the way.
    Last edited by Ao1; 03-30-2011 at 02:17 AM.

  2. #2
    PCMark V Meister
    Join Date
    Dec 2009
    Location
    Athens GR
    Posts
    771
    thnx Ao1

  3. #3
    Xtreme Guru
    Join Date
    Aug 2009
    Location
    Wichita, Ks
    Posts
    3,887
    yes that is an interesting idea. however, i think a big thing to take into consideration here is when you have the high QD situations that we run into.
    everyone says we never go over QD of 4 with normal usage. not true. you go over it all the time. you never go over a average of 4QD is a more accurate way of saying it. the high QD spikes are resolved so quickly, that it is not showing up in the average.
    in high QD situations that last only seconds, the system will lag or hang. the drives with higher random performance at the hgiher QD will not lag at those points.

    I am game, lets test this!

    so lets talk methodology here...how are we going to go about it? what will be the baseline?
    Last edited by Computurd; 10-18-2010 at 05:55 PM.
    "Lurking" Since 1977


    Jesus Saves, God Backs-Up
    *I come to the news section to ban people, not read complaints.*-[XC]Gomeler
    Don't believe Squish, his hardware does control him!

  4. #4
    Xtreme Mentor
    Join Date
    Feb 2009
    Posts
    2,597
    The 1st thing I learn is that TRIM commands are constantly being executed with an Intel SSD.


    Now I will look at QD etc.

  5. #5
    Xtreme Mentor
    Join Date
    Feb 2009
    Posts
    2,597
    The "Solid State Disk (SSD) I/O Performance Analysis Add-On" is quite easy to install if you follow this guide.

    http://www.hyperio.com/hIOmon/Screen...hIOmonCfgSetup

    With the default time period the CVS file will be updated every 10 minutes and a summary of storage activity will be provided.

    So on to some monitoring:
    Here I am running 75 processes and the CPU is maxed out.


  6. #6
    Xtreme Mentor
    Join Date
    Feb 2009
    Posts
    2,597
    Here is light use. Around 68 processes running but most are background;nothing heavy, just WMP, office, IE. PS MS messeneger etc.


    This is a fresh script run
    Last edited by Ao1; 10-19-2010 at 10:19 AM.

  7. #7
    Xtreme Mentor
    Join Date
    Feb 2009
    Posts
    2,597
    Here is what happens when I run AS SSD Benchmark.


  8. #8
    Xtreme Mentor
    Join Date
    Feb 2009
    Posts
    2,597
    To compare more easily

    Heavy use (CPU maxed out)


    Light use (This is a fresh script run)


    AS SSD Benchmark (This is cummulative to the heavy use script).


    MW2 Multi Player (Fresh script with only MW2 runing).


    MW2 Single Player (Fresh script with only MW2 runing).


    Here I copy the Adobe folder from Program Files to the desktop: 2502 Items in the directory with a combined size of 710MB


    Here I copy an AVI file from desktop to the C drive. File size 635MB


    Here I ran a winsat disk command.


    Some observations

    If you are multitasking with apps that require processing power you are unlikely to hit maximum sequential speeds because the CPU will most likely max out.
    It would seem that the maximum QD length gets quite high at times, but unless you run something like AS SSD, which tests at up to QD64, it seems very hard to get above an average QD of 2 (Just as you said Comp)
    Last edited by Ao1; 10-22-2010 at 02:00 AM.

  9. #9
    Xtreme Member
    Join Date
    May 2010
    Posts
    112
    I believe that there was an earlier question about the "Read Max Queue Length" and the "Write Max Queue Length" metrics (more specifically, that they appear to stay the same no matter what activity is going on).

    First a disclaimer: I work for hyperI/O (the company that has designed/developed the hIOmon software utility package), but I am here only to help answer technical questions if that is of interest to folks.

    Now about the two metrics. To keep this post short, a couple of things to consider:

    1) The metrics that are being collected/exported are cumulative metrics (as per the particular configuration performed via the use of the hIOmon "SSD I/O Performance Analysis Add-On" script).

    That is, the metrics reflect the accumulated values as seen by the hIOmon software since it first began monitoring the specified I/O operations (more technically, since the hIOmon "Filter Selection" configuration file, which specifies what is to be monitored and what is to be collected, was loaded/activated). The configuration and activation of the "Filter Selection" file was automatically performed by the use of the "SSD I/O Performance Analysis Add-On" script.

    So then, the "Read Max Queue Length" metric reflects the highest read queue length see by the hIOmon software since it began monitoring the requested device(s). Moreover, this value will not change until the hIOmon software observes a higher value (or until the/a Filter Selection is reloaded/reactivated).

    2) The "Read Average Queue Length" reflects the overall average number of read I/O operations as observed by the hIOmon software that were "outstanding" (i.e., issued but not yet completed) for the respective device. Again, this is an overall average since the hIOmon Filter Selection was loaded/activated.

    3) The various metrics collected/exported by the hIOmon software are described/defined within the "hIOmon User Guide" document (see "Table 5" within the document for starters).

    4) If you are using the "SSD I/O Performance Analysis Add-On" configuration script to compare various scenarios with each other, then you will need to re-run this script before each scenario. This will cause the hIOmon Filter Selection to be reload/reactivated.

    Hopefully the above was of help.

  10. #10
    Xtreme Mentor
    Join Date
    Feb 2009
    Posts
    2,597
    ^

    Thanks for coming to xtreme to help out and thanks for a great piece of software. I'm still trying to get to grips with all the features but I have a feeling some questions will follow.

    EDIT:
    OK first question. What is being monitored on the TRIM command? Is it recording when the OS sends the command signal or is it when the SSD actually deals with the command?

    2nd question. The "Write Max Queue Length" seems quite high even for light use. Is that because the small writes are being cached so that they are written more effectivly to the SSD to reduce wear?
    Last edited by Ao1; 10-19-2010 at 11:04 AM.

  11. #11
    Xtreme Member
    Join Date
    May 2010
    Posts
    112
    Quote Originally Posted by Ao1 View Post
    ^

    Thanks for coming to xtreme to help out and thanks for a great piece of software. I'm still trying to get to grips with all the features but I have a feeling some questions will follow.

    EDIT:
    OK first question. What is being monitored on the TRIM command? Is it recording when the OS sends the command signal or is it when the SSD actually deals with the command?
    Thanks for the welcome to xtreme and for the kind comment about the hIOmon software.

    The hIOmon software does have many features, which are meant to address the wide variety of questions and scenarios that can arise when probing deeper (i.e., "peeling the onion") becomes necessary as an investigation/analysis unfolds.

    Anyway, regarding your first question, the short answer is that the hIOmon software can capture TRIM commands from the OS perspective (i.e, the former in your second question above). This is in line with a primary design goal of the hIOmon software: to capture a comprehensive set of I/O operation and performance metrics from the perspective of applications/processes and the OS (in contrast to the device perspective, i.e., as seen by the actual device "at the other end of the cable").

    More specifically to your question, the hIOmon software can be configured to capture I/O operation metrics for "control" I/O operations (specifically "Device Control" I/O operations) that specify "Manage Data Set Attributes (MDSA)" requests. These MDSA requests include "TRIM" action requests.

    These MDSA "TRIM" action requests are generally issued by the file system related components of the operating system. The hIOmon software can capture the issuance of "TRIM commands" at either the physical volume and/or physical device level within the Windows operating system (the latter is similar to the "PhysicalDisk" level shown within the Windows Performance/System Monitor) regardless of the source.

    Additional details about the TRIM command support provided by the hIOmon software can be viewed within the "Background Information" section here:

    http://www.hyperIO.com/hIOmon/AddOns...GadgetHelp.htm

  12. #12
    Xtreme Mentor
    Join Date
    Feb 2009
    Posts
    2,597
    OK thanks for that. So my 4th post should read:
    The 1st thing I learn is that TRIM commands are constantly being sent by the OS.

    I'm going to do a lot more reading now so I can understand the full potential of this software.

  13. #13
    Xtreme Guru
    Join Date
    Aug 2009
    Location
    Wichita, Ks
    Posts
    3,887
    well i have been doing some testing with it, getting it figured out, i am mainly using the real time I/O functions, but i do have one big question:
    certain apps will have high QD like outlook will get a qd of 12, and Windows Media Player has had QD as high as 90 as the "Read Max Queue Depth" when using the I/O summary.
    also, Kaspersky seems to have high max QD values.
    My question is this though, is that just the QD of that individual process, or its QD in relation to the system as a whole?

    for instance, the queue depth for outlook at the time stamp of 19:13:51 is 2,
    but also at that time of 19:13:51 the QD of windows media player is 12
    so at that same time, the QD should be 14?

    so in essence, the QD is measured per process? how would one go about seeing the cumulative queue depth for all processes, programs, etc?
    Last edited by Computurd; 10-19-2010 at 04:41 PM.
    "Lurking" Since 1977


    Jesus Saves, God Backs-Up
    *I come to the news section to ban people, not read complaints.*-[XC]Gomeler
    Don't believe Squish, his hardware does control him!

  14. #14
    Xtreme Member
    Join Date
    May 2010
    Posts
    112
    Quote Originally Posted by Ao1 View Post
    2nd question. The "Write Max Queue Length" seems quite high even for light use. Is that because the small writes are being cached so that they are written more effectivly to the SSD to reduce wear?
    Unfortunately, there is not a single short, simple answer to your question above.

    As I believe you will come to find out, there can be a number of factors that can contribute to incurring a "high" maximum queue length even during ostensibly "light" use.

    One approach is to isolate what actually is occurring concurrently when the max queue length is observed down at the physical device level.

    The basic idea here is that you can utilize the various configuration options (and "Add-Ons") available with the hIOmon software to further "hone-in" on particular factor(s) that are contributing to high max queue lengths.

    For instance, you could use the hIOmon "Process I/O Performance Analysis Add-On" (which is included within the standard hIOmon software installation package) to help identify those specific processes/applications that are experiencing the greatest amount of I/O activity (perhaps with their own respective max queue lengths) that requires actual accesses to the "physical device" when the max queue length is detected by the hIOmon software for the physical device.

    I hope that I don't come across as avoiding your question, but the underlying inherent complexity (along with the many subtle interactions amongst concurrent processes and I/O operations, moreover along the overall I/O stack within the operating system, particularly at specific points, i.e., at the "file" level, at the "physical device" level, etc.) can require a more detailed probing of what exactly is going on within the particular system.

    And not to belabor the point, but this is where the ability to capture relevant empirical metrics can be quite helpful (e.g., to substantiate or refute speculation and theory).

    Lastly, some other questions that you might want to consider in this regard:

    http://www.hyperIO.com/hIOmon/hIOmon...fQuestions.htm

    And a final note: The discussion of the intricacies of the "system file cache" management provided by the Windows operating system is a prolonged one.

    In any case, one approach that you could take towards answering your question is to see how much system file cache write activity is actually occurring when under "light" use as shown by the hIOmon "System File Cache" I/O metrics.

  15. #15
    Xtreme Guru
    Join Date
    Aug 2009
    Location
    Wichita, Ks
    Posts
    3,887
    I did come to the conclusion that the QD are 'per process' by loading iometer, and setting a 4k random file to read at 64QD, while also loading other programs, i ran a test
    the other programs only showed their own respective QD values in the monitoring. the dynamo.exe (iometer) however showed its own individual qd of 64 , of course.

    The main thrust of our testing here is to find out the value of SSD in raid, and its impact upon the actual use of an moderate to heavy user.
    There are two basic schools of thought here, the first being that an individual SSD is fast enough that it can handle even heavy use identically to a SSD raid array.
    Or, even as an extension of that, that a SSD with a lower random performance at high QD random will perform essentially the same as some of the newer, faster SSD that have much faster high QD performance.

    Tools used to measure the QD of a system that we have explored using usually rotate around average QD.
    however, even using the windows built in performance monitoring counters you can see there are big QD spikes in heavy usage, but that they are resolved quicker with faster devices/arrays.
    since these spikes are resolved quickly, the average QD does little to quantify how high we are hitting.
    but the real question arises that we know the average desktop performance rarely goes above 4-6, but I am trying to see how high it spikes, and how fast those spikes are resolved, to compare a single SSD v. an SSD array that can do 160,000 IOPS @ 4k random.

    is there a way to show the maximum QD for the individual device?

    EDIT: yeah now i see it.
    Last edited by Computurd; 10-19-2010 at 05:09 PM.
    "Lurking" Since 1977


    Jesus Saves, God Backs-Up
    *I come to the news section to ban people, not read complaints.*-[XC]Gomeler
    Don't believe Squish, his hardware does control him!

  16. #16
    Xtreme Member
    Join Date
    May 2010
    Posts
    112
    Quote Originally Posted by Computurd View Post
    is there a way to show the maximum QD for the individual device?
    The hIOmon software can be configured to collect "summary" metrics upon an individual file, process, and/or device basis:

    http://www.hyperIO.com/hIOmon/hIOmon...zedMetrics.htm

    If you are collecting summary metrics upon an individual process basis, then indeed the maximum QD metric within the "summary metrics" for the process will reflect the maximum seen for the respective process.

    Similarly, if you are collecting summary metrics upon an individual file basis, then the maximum QD metric within the summary metrics for a particular file reflects the max seen for the respective file.

    And of course, the same applies for the summary metrics collected upon an individual device basis. In the case of summary metrics for a specific "physical device" (i.e., at the "physical disk" level within the operating system), the max QD is that seen for/at the respective device (regardless of the "source", i.e., whichever process initiated the I/O operation).

    So essentially the summary metrics for a file, process, or device reflect those metrics that pertain just to that file, process, or device.

    As noted above, this is all configurable and moreover allows you to observe what is occurring for a particular file, process, or device upon an individual file, process, and device basis respectively.

    Oops, just saw your edit. Hopefully the above provides further confirmation.

    Also, you raise a very good point about distinguishing between average and maximum QD.

  17. #17
    Xtreme Guru
    Join Date
    Aug 2009
    Location
    Wichita, Ks
    Posts
    3,887
    wow this tool is very functional! As i am exploring more of it i am seeing that we can do some cool stuff here....

    Basically i loaded two I7 920 systems, one having a single Vertex LE (SF based) SSD and the other with my array of 5 vertex (gen 1) SSD on a areca 1880IX-12 w/4gb cache, and began monitoring with a C:\* filter.
    Then i turned on programs on each computer one by one...pretty much one after the other....
    five instances of firefox, Windows Media player (playing), then acronis image home (did NOT do an image though, just let it sit on) my passsword manager, my sound manager, and a camera feed was turned on on both rigs.
    I also have a host of exact same desktop gadgets running on both computers.
    Then once i had all this running i turned on the game FarCry2 simultaneously (or very close to ) on both rigs, and let the intro run, where you have to ride around in a jeep. however from previous testing i know that during this sequence the program is streaming from the disk pretty heavily.
    then i shut down the programs in reverse order (first on one, then on the other), and stopped logging

    Vertex LE system


    and then Areca array system


    Now, i know this is hardly conclusive data here, but it does show a taste of array v single SSD performance of sorts. The array handles the high QD situations much more effectively of course.
    Now, to figure out how to record, then replay on a seperate computer, a trace, and monitor it. if that is possible of course....
    Last edited by Computurd; 10-19-2010 at 06:09 PM.
    "Lurking" Since 1977


    Jesus Saves, God Backs-Up
    *I come to the news section to ban people, not read complaints.*-[XC]Gomeler
    Don't believe Squish, his hardware does control him!

  18. #18
    Xtreme Member
    Join Date
    May 2010
    Posts
    112
    Quote Originally Posted by Computurd View Post
    Now, to figure out how to record, then replay on a seperate computer, a trace, and monitor it. if that is possible of course....
    Not exactly sure what you would like to do as mentioned above.

    Are you interested in capturing an "I/O trace" on one machine and then displaying the same "I/O trace" upon another machine?

    Or do you want to capture an "I/O trace" on one machine, then replay the same "I/O trace" upon another machine (i.e., use the I/O trace as "input" and actually perform the same I/O operations in the same sequence upon another machine)?

    Or am I completely confused?

  19. #19
    Xtreme Guru
    Join Date
    Aug 2009
    Location
    Wichita, Ks
    Posts
    3,887
    capture an "I/O trace" on one machine, then replay the same "I/O trace" upon another machine (i.e., use the I/O trace as "input" and actually perform the same I/O operations in the same sequence upon another machine)?
    yup. but that may be unnecessary. not sure if that could be done with this. but setting up some sort of batch file to initiate programs in the same sequence (possibly with some time intervals between) could be just as effective. the main goal is to be able to compare the two systems' I/O performance under identical load patterns.
    "Lurking" Since 1977


    Jesus Saves, God Backs-Up
    *I come to the news section to ban people, not read complaints.*-[XC]Gomeler
    Don't believe Squish, his hardware does control him!

  20. #20
    Xtreme Member
    Join Date
    May 2010
    Posts
    112
    Quote Originally Posted by Computurd View Post
    yup. but that may be unnecessary. not sure if that could be done with this. but setting up some sort of batch file to initiate programs in the same sequence (possibly with some time intervals between) could be just as effective. the main goal is to be able to compare the two systems' I/O performance under identical load patterns.
    I must admit that I generally try to avoid the use of the "I/O Trace" option.

    Please don't get me wrong, there can indeed be situations where using the "I/O Trace" option is definitely needed to capture the particular information required.

    But from the outset, the hIOmon software has stressed the use of the "summary" option, which can answer so many questions in a much simpler, easier, quicker, more productive and efficient, etc. manner (e.g., rather than having to deal with tens of thousands if not hundreds of thousands of individual I/O operation trace records - there can often be some troublesome "scaling" issues, for instance, with the I/O trace approach).

    Anyway, for perhaps the more "adventurous" folks, the hIOmon software does provide the hIOmon Add-On Support for the "Intel NAS Performance Toolkit (NASPT)".

    Basically, this support enables you to capture an I/O operation trace, which can then be exported by the hIOmon software to a disk file within the XML trace input file format that is required by the Intel NASPT tools. In turn, this export file can then be used directly (without conversion) as a NASPT trace input file for both the NASPT Analyzer and the NASPT Exerciser tools (which essentially provide a "replay" option along the lines that you mentioned).

    Additional information about this hIOmon Add-On can be found within the "hIOmon Add-On User Guide" document.

    But back to the "batch file" approach that you also mentioned. The hIOmon software also includes a "Benchmarking Support Add-On" - surprise, surprise

    This Add-On helps in efforts to automate the benchmarking process. That is, it can be used to quickly and easily utilize the hIOmon software so as to retrieve real-time, user-specified "summary metrics" and then dump them (i.e., export them) to a CSV file. This is done through the use of several batch files that are included with this Add-On.

    More info here:

    http://www.hyperIO.com/hIOmon/AddOns...dOnSupport.htm

  21. #21
    Xtreme Guru
    Join Date
    Aug 2009
    Location
    Wichita, Ks
    Posts
    3,887
    well awesome now to figure this out!
    "Lurking" Since 1977


    Jesus Saves, God Backs-Up
    *I come to the news section to ban people, not read complaints.*-[XC]Gomeler
    Don't believe Squish, his hardware does control him!

  22. #22
    Xtreme Guru
    Join Date
    Aug 2009
    Location
    Wichita, Ks
    Posts
    3,887
    well now delving into some more complicated aspects of this i see...
    elevated cmd prompt to admin status
    then :


    hmmm doing this CLI might not be the easiest way..wondering on how to do this via GUI?
    i have gotten it to save the .csv and it has a ton of useful data.

    EDIT: the benchmarking set does not actually perform a benchmark? it just records data if i am understanding this correctly. so hows about we use it in conjunction with everyones fave??
    YuP! some PCMark Vantage action is inbound fellas. lets see what a trace summary of PCMV looks like


    btw overthere we are big time PCMV junkies in here..


    @steve-ro..been quiet on the PCMV front, thought the aussies would come gunning for ya for sure steve-o...seems the dust has settled on the hall of fame for the time being...
    Last edited by Computurd; 10-19-2010 at 08:03 PM.
    "Lurking" Since 1977


    Jesus Saves, God Backs-Up
    *I come to the news section to ban people, not read complaints.*-[XC]Gomeler
    Don't believe Squish, his hardware does control him!

  23. #23
    Xtreme Member
    Join Date
    May 2010
    Posts
    112
    Quote Originally Posted by Computurd View Post
    well now delving into some more complicated aspects of this i see...
    elevated cmd prompt to admin status then :
    It might be better to troubleshoot this "Access Denied" issue offline so that we don't encumber this thread with stuff that folks might consider off-topic.

    In any case, I suspect that there was more than one open hIOmon client attempting to concurrently change the operation/configuration of the hIOmon software. Could you please take a quick look into the Application Event Log and see if there is an EVENT ID 785, Source: hIOmonClientComm entry?

    I just ran the hIOmonBenchmarkExport batch file on a Windows 7 x64 system (both from an admin and a guest account) without any problems, so I'm a bit puzzled.

    Thanks

    Also, you are correct: the hIOmon "Benchmarking Support Add-On" does not actually perform/drive any benchmarking itself. That is left up to the user's particular tastes/desires

    Rather the primary intent of the Add-On is to help "clear" the summary metrics before the actual benchmark run and then dump the collected summary metrics during and/or the benchmark run as part of an automated process.

  24. #24
    Xtreme Mentor
    Join Date
    Feb 2009
    Posts
    2,597
    Here is a summary of a couple of days worth of cumulative data monitoring statistics with normal use.

    • Max Av QD Reads = 1.653
    • Max Av QD Writes = 2.431
    • Max Av QD Reads & Writes = 1.838
    • Max Read QD = 18
    • Max Write QD = 70

    Now I will try the more advanced features to see what causes the peak QD's.

    I'm also going to swap back to HDD (when I get time) to see how QD's compare to SSD.


  25. #25
    Xtreme Mentor
    Join Date
    Feb 2009
    Posts
    2,597
    Hi overthere,

    I have a few questions and apologies if they are a bit dumb.

    Read Data Xfer = the amount of data transferred?

    Read Xfer Max size = the maximum block size transfer?

    Here I ran a winsat disk command. The QD's went through the roof!

    Last edited by Ao1; 10-22-2010 at 03:00 AM.

Page 1 of 16 123411 ... LastLast

Bookmarks

Bookmarks

Posting Permissions

  • You may not post new threads
  • You may not post replies
  • You may not post attachments
  • You may not edit your posts
  •