

how about bloomfield, do we need to calibrate


how about bloomfield, do we need to calibrate


Uncle,
Before you kill me, I would like your input on how to calibrate realtemp properly. I seem to be having differences in temperature readings from RealTemp and HW Monitor. Running the sensor test now and will post a screenshot.
Shoot now.
***removed photo because it affected the layout****
What do you advise? Do I offset the cores by a few degrees?
Mirror for RealTemp on my RS Account:
http://rapidshare.com/files/32808805...pBeta.zip.html
Last edited by Wishmaker; 01-09-2010 at 04:10 AM.
My Photo Website
MOBO: Gigabyte U3DR /1.6 Bios FI
CPU: I7 920@ 3.8 GHz
COOLER: Wobble X (CF2)/ Push-Pull ZF3
RAM : 6GB TRI KIT G-SKILL DDR3 CL7
Video: CrossFireX XFX ATI 4890 XXX 1GB DDR5 GPU: 1 GHz / MEM: 4 GHz
HDD: 1 * 500GB WD Caviar+RAID 0 2 * 1 TB SAMSUNG SPINPOINT
Optical: Sony Optiarc Labelflash
Audio : X-FI TITANIUM
PSU: Corsair CMPSU-750TX
Case: Antec 902
We had this discussion before here or somewhere else and I have no idea what HW Monitor is reporting and why its temperatures are different. All software should be reading the same sensors and should be reading TJMax directly from each CPU so there's no reason why any software should be reporting something different. Core Temp and RealTemp are usually exactly the same. HW Monitor is different but I don't know why.
Your first 3 cores look very close. I'd leave them as is. The majority of Core i7-920 CPUs that I've seen seem to have a 5C difference in TJMax between core 3 and core 0. Yours look more like about 3C. You could set that one to 103C or leave it as is and keep in mind that it's probably not 100% accurate. For all of these, I'd trust core 0 more than any of the other cores. These sensors are excellent out of the box so there's no use getting too technical trying to calibrate them.
My 2 cents. Calibrate HWMonitor because your Nehalem has a TJMax 100 and it's written in MSR so what RealTemp shows you is for real and what HWMonitor shows is something else but I'm not sure what.
What's CoreTemp or Everest readings?
LE: Kevin was fast.
If it ain't broke... fix it until it is.
Cheers for the support lads. I won't touch them
My Photo Website
MOBO: Gigabyte U3DR /1.6 Bios FI
CPU: I7 920@ 3.8 GHz
COOLER: Wobble X (CF2)/ Push-Pull ZF3
RAM : 6GB TRI KIT G-SKILL DDR3 CL7
Video: CrossFireX XFX ATI 4890 XXX 1GB DDR5 GPU: 1 GHz / MEM: 4 GHz
HDD: 1 * 500GB WD Caviar+RAID 0 2 * 1 TB SAMSUNG SPINPOINT
Optical: Sony Optiarc Labelflash
Audio : X-FI TITANIUM
PSU: Corsair CMPSU-750TX
Case: Antec 902
For me:Originally Posted by burebista

Core Temp reports same numbers than Real Temps
and Everest (5.30) report same numbers than HWMonitor
i7 2600K | Asus Maximus IV Extreme | 8GB DDR3 1600 C9 Corsair Vengeance | GTX580 Matrix Platinum | Vertex 2 120GB | Auzen X-Fi HomeTheater HD | Corsair AX1200 | FT02
EK Supreme HF Full Nickel | MCR320 XP + GT AP15| DDC3.25 + EK Top V2| EK Multioption Res X2 150 Advance | Bitspower Fittings & Rotaries
My flickr
Have you tried Everest 5.30.1977 or newer? It has changed the way it reads and shows temps.
http://www.lavalys.com/support.php?lang=en
Maximus 5 Gene | i7-3770K @ 5GHz | ADATA 2x2GB @ 2.6GHz 9-12-10-28-1T | HD7970 @ 1200/6400
Rampage 4 Extreme | i7-3930K @ 5GHz ||| X58-A OC Orange | i7-980X @ 4.6GHz
I will see it.
i7 2600K | Asus Maximus IV Extreme | 8GB DDR3 1600 C9 Corsair Vengeance | GTX580 Matrix Platinum | Vertex 2 120GB | Auzen X-Fi HomeTheater HD | Corsair AX1200 | FT02
EK Supreme HF Full Nickel | MCR320 XP + GT AP15| DDC3.25 + EK Top V2| EK Multioption Res X2 150 Advance | Bitspower Fittings & Rotaries
My flickr
I think there is a second way to read core temperatures from these CPUs which does some sort of averaging. The method RealTemp and Core Temp uses is to read the instantaneous temperature and report that.
Other programs might be using this second method because their reported temperatures do not directly correspond with what the temperature register is showing.
Yep, everest (the 5.30.1977 one) and real temp now show same numbers.
i7 2600K | Asus Maximus IV Extreme | 8GB DDR3 1600 C9 Corsair Vengeance | GTX580 Matrix Platinum | Vertex 2 120GB | Auzen X-Fi HomeTheater HD | Corsair AX1200 | FT02
EK Supreme HF Full Nickel | MCR320 XP + GT AP15| DDC3.25 + EK Top V2| EK Multioption Res X2 150 Advance | Bitspower Fittings & Rotaries
My flickr
Hey Unclewebb I got one for you with my 4870x2....
You got me excited when you mentioned that you added ATI card support. I downloaded RT 3.5 but when I try to run RT no window shows up. I can open up process explorer and see it though its not using resources like it is just sitting there idle. If I try to "bring window to the front" pe tells me there is no window. I can go into the ini file and activate the"nogpu" line and then it will open up without a problem.
I found 3.49 and don't have any problems with RT and it shows my first gpu just fine. If i open the gpu window up and click to the second gpu temp, it says gpu 3 but the temps don't change. I can click it again and go back to gpu 1 but the temps still don't change. I can close the window and the gpu temp in RT will work fine.
This is on my system in my sig. The card is actually in the 3rd slot to give the D14 some breathing room. I tried moving it back to the first slot to see if it would change anything.....it didn't.
If I can help you let me know. Not a big deal for me but am looking forward to when you get it working the way you meant for it to be.
CM HAF 932 | Intel i7 920 | 6GB Corsair Dominators | Asus P6T6 WS Revolution | Xfire XFX 5870 | Raid 0 WD VR 300GB | LG Blu-ray/HD-DVD | Enermax Rev 85+ 1050w | Viewsonic VX2835wm | Logitech MX3200 | W7 Pro x64
The ATI code definitely needs some work in RealTemp, especially when using CrossFire. The 5750 card I bought for development purposes was such a buggy, crashing POS that I returned it and got a refund rather than try my luck again. Hardware and software both seemed to have some issues so I went back to Nvidia.
I should have some time next week to have another look at this but without hardware to test on I'm not sure how much progress I can make. Thanks for the offer to help. I'll try to get back into this project next week.
I've been working on a different project the last few weeks called ThrottleStop which is designed to help Dell's throttling laptop issues. I added support for the Alienware M15x today. Anyone who has purchased a Dell laptop in the last year needs to do some testing. They have quite a few models that throttle like crazy and slow down to a crawl when fully loaded.
http://forum.notebookreview.com/show...postcount=2144
Hey uncle,
With the latest RT version, my Core 3 keeps on disappearing from my taskbar. If I run RT all 4 cores show up but after a while, one of them, Core 3, is hidden by W7 due to inactivity. I specified that I don't want that but W7 keeps on doing it. I did not have this problem with the previous version.
On a side note,
RT does not seem to recognise my CFX configuration. When I select a different GPU the temps remain unchanged. This is not right because one of them is supposed to run hotter because it is kind of suffocated.
Last edited by Wishmaker; 01-09-2010 at 04:21 AM.
My Photo Website
MOBO: Gigabyte U3DR /1.6 Bios FI
CPU: I7 920@ 3.8 GHz
COOLER: Wobble X (CF2)/ Push-Pull ZF3
RAM : 6GB TRI KIT G-SKILL DDR3 CL7
Video: CrossFireX XFX ATI 4890 XXX 1GB DDR5 GPU: 1 GHz / MEM: 4 GHz
HDD: 1 * 500GB WD Caviar+RAID 0 2 * 1 TB SAMSUNG SPINPOINT
Optical: Sony Optiarc Labelflash
Audio : X-FI TITANIUM
PSU: Corsair CMPSU-750TX
Case: Antec 902
I'm innocent. I can't remember doing anything recently to RealTemp that would change how the system tray works. I'll see if there is anything I can do differently to work around this new Windows 7 feature but so far no one has reported this problem so I'm not sure what's going on. Are you sure you have the Windows 7 System Tray notification stuff set up correctly?
I'm happy to see that RealTemp 3.50 at least runs on your ATI CrossFire system without blowing up.
Here's the theory. When running CrossFire, one of your GPUs is supposed to go to sleep to save power at idle. In 2D mode, you don't need an uber GPU setup to move the mouse pointer around on the screen. To monitor the core temperature of each GPU, I would need to make sure that both GPUs are awake which would kill this power saving feature. I didn't think that would be a good idea but most users aren't happy when RealTemp only reports the temperature for one GPU when at the Desktop.
When you start gaming and both GPUs are actively working, RealTemp is designed to monitor both GPUs and collect temperature data for both of them and should report the highest GPU temperature in the GPU button on the main screen. That's the theory.
Does this work correctly? At the moment I don't know. Without having access to an ATI GPU let alone a pair of them in CrossFire mode makes development a pain in the butt.
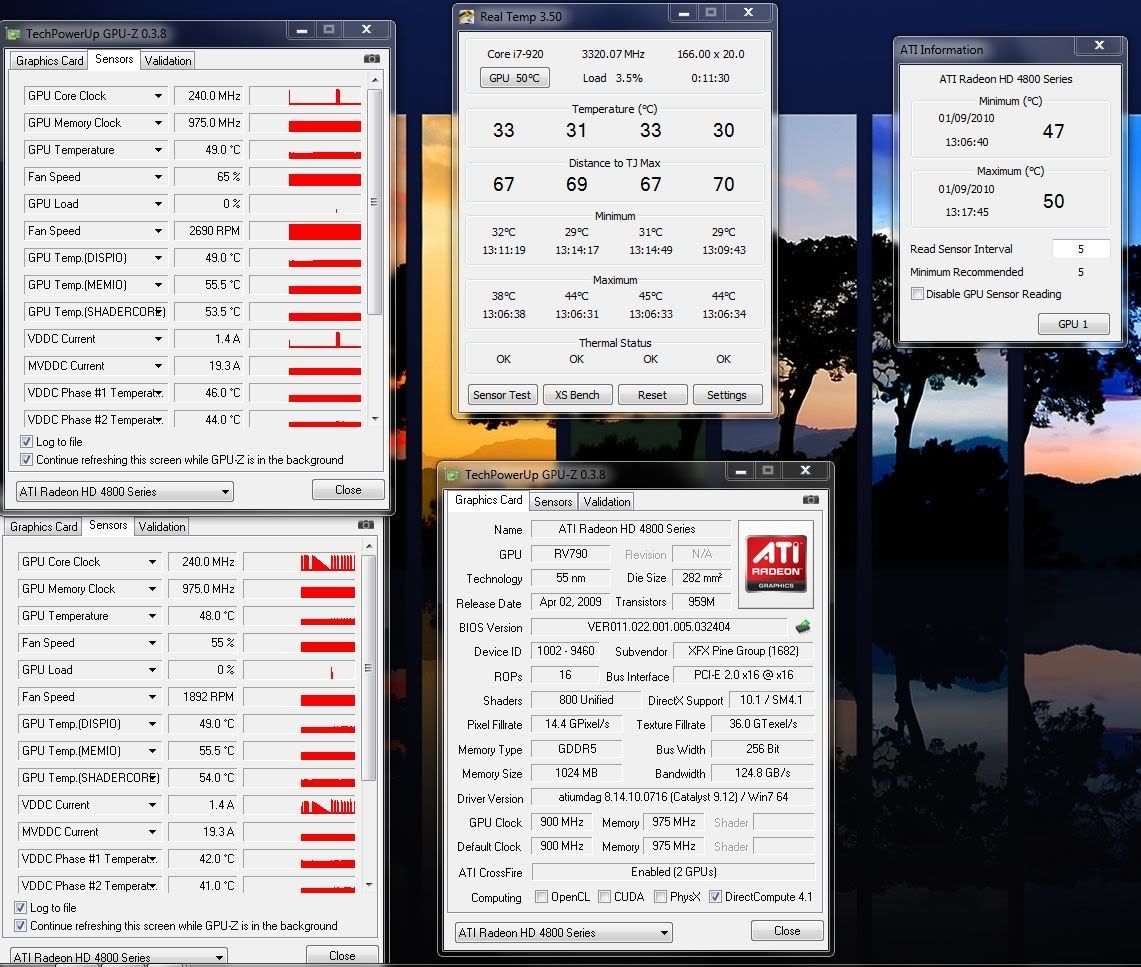
You could try running a GPU-Z log while gaming and compare the peak GPU core temperature to what RealTemp logs to see if RealTemp really is reading both GPUs when in 3D and reporting the highest GPU core temperature. It should but I don't have a way to test this.
I might try to redesign this and let RealTemp wake up both cores while in 2D so it can read and report the temperature of both cores. There's not really a practical reason to do this since your GPU core temperature shouldn't be an issue in 2D but I think most enthusiasts would be happier if I said to hell with power saving and went for more reporting. At least there's a reason why RealTemp does weird things on CrossFire systems.
I was hoping to get back to work on RealTemp last week but I'm still having fun on the Notebook forum working on my new ThrottleStop program. Maybe next week. I'll put your name on my CrossFire testers list. Hopefully with some help I can make some improvements.
Uncle,
I managed to sort out the Tray Issue with a full windows 7 re-install. I was having issues with CFX in Dirt 2 and after 20 million Catalyst drivers installed and removed, I had to format. Windows 7 was the culprit not RT. Regarding CrossFire, behaviour of the 2 cards is influenced directly by the Catalyst. For example there is a certain version floating around that completely shuts down the second card. It blocks the fan at 19 % and gives it a more aggressive power saving option. For those who want to try it, 9.12 Hotfix. This is an interesting feature but as a user I don't like losing control of my card. I've no power on fan or anything, until, as you correctly stated, I run a game and CFX kicks in.
Other Catalyst drivers such as 9.10/9.11/9.12/ (beta) 10.1 which is a modified 9.12 with CFX profiles, put the second card in sleep mode but do not take control away from the user. I can still set fan speed and, influence, the temps, whereas with the 9.12 hotfix, the one I mentioned above, I can't do anything. CCC decides to adjust speeds and the 4890s tend to get hot. I don't like it when its idling at 68 degrees because CCC keeps the fan at 19 %. Amazing power saving feature, innit?
I will gladly offer support because it is the least I can do. You've put so much in RT and I know it is annoying when someone comes with a few issues and starts whining. Let me know what you want me to do and I will do my best to offer feedback. It would be great to have 1 app to monitor everything. It is rather annoying that I have to run MSI Afterburner for GPU only. Do you think there is a way to implement in RT a feature similar to the MSI Afterburner one where you have your GPU, for RT CPU, temps displayed while gaming? That would be great
My Photo Website
MOBO: Gigabyte U3DR /1.6 Bios FI
CPU: I7 920@ 3.8 GHz
COOLER: Wobble X (CF2)/ Push-Pull ZF3
RAM : 6GB TRI KIT G-SKILL DDR3 CL7
Video: CrossFireX XFX ATI 4890 XXX 1GB DDR5 GPU: 1 GHz / MEM: 4 GHz
HDD: 1 * 500GB WD Caviar+RAID 0 2 * 1 TB SAMSUNG SPINPOINT
Optical: Sony Optiarc Labelflash
Audio : X-FI TITANIUM
PSU: Corsair CMPSU-750TX
Case: Antec 902
When working with ATI drivers and software, I gave up early in the project because it seemed that not all the bugs were being caused by me. I still scratch my head when I see RealTemp working fine for one ATI CrossFire combo but another user reports that the same set up causes RealTemp to crash hard.
I'll try to put some more time into it this week to see if we can figure anything out.
You could always try using the RealTemp RivaTuner plugin. Instead of running RealTemp you just run RivaTuner instead and with the plugin you can see all of the RealTemp data on screen while gaming.
When my X3440 gets above 75°C, I noticed that it begins to throttle and lower its multiplier.
I thought these CPUs could handle the heat, but mine seems to have some issues when it gets towards those temperatures. :/
All power saving modes are disabled and 'High Performance' setting was used in Windows 7.
The weird thing that is pondering me is why my Processor Power Management doesn't give me the minimum and maximum power state. Is this normal?
You usually need to have EIST / SpeedStep enabled in the bios for the Minimum and Maximum processor state to show up in the Control Panel -> Power Options. Some motherboards need EIST enabled for turbo boost to work properly too since the two are related. Once EIST is enabled, disable C1E and set the Minimum to 100% to keep the multi from dropping down at idle if that's what you want to happen.
Thermal throttling is when the multiplier drops down to its minimum which I think is 9.0X for an X3440. Turbo throttling happens when your multiplier starts dropping down to its default value. Turbo boost is dependent on core temperature so somewhere around 80C, some motherboards and CPUs will disable all turbo boost leaving you with a 19X multiplier. Some motherboards let you bypass turbo throttling based on power consumption or core temperature while other boards do not.
Last edited by unclewebb; 01-12-2010 at 07:32 PM.
Arg, I tried enabling SpeedStep and set the Minimum to 100% but I am still getting the multiplier to throttle.
Now in my BIOS, there is a setting called CPU Thermal Throttling. I'm 99.9% sure that is what is causing this. The only problem is that it is grayed out and it is set to Enabled.
Edit: It looks like this, except that it is grayed out.

Last edited by SimpleTECH; 01-12-2010 at 10:45 PM.
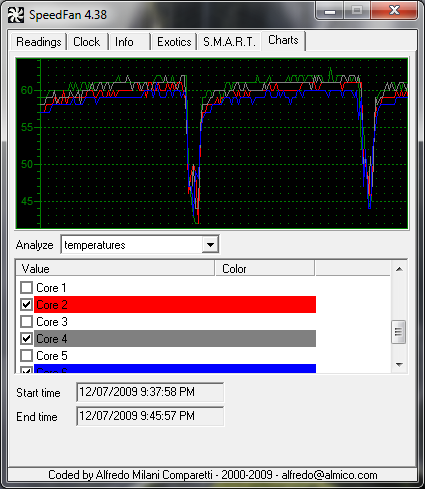
Based on the 13.5% load reported by Real Temp, I'd wager you're simply seeing the near-idle periods between LINPACK iterations. LINPACK-based stability tests like LinX and Intel Burn Test have cyclic loads which last for a few minutes at 100% and then have a few seconds of almost no load in between. It's extremely regular. Check out these temp graphs of mine (concentrate on changes in temp, as the absolute temps are wrong), they give you an idea of how much load drops at regular intervals:
Also, it's a good thing that Thermal Throttling is greyed out. Don't disable it
Last edited by randomizer; 01-13-2010 at 06:23 AM.
Yeah I know that. It's when my CPU downclocks that is worrying me since I cannot tell if my CPU is stable or not during testing. One run might be 45.2 GFlops when it is running normal but once it begins to throttle it's 36 GFlops (or whatever).
I'm going to go ahead and reset my HSF. I have a weird feeling that the reason it is downclocking is because of a faulty sensor.
This topic was brought up in the Notebook forum I've been hanging out at recently. It might be a Windows 7 feature / issue where it is ignoring the Minimum processor state when you set it to 100%. This used to work fine in Vista and was the best way to keep your multiplier from sagging down. It still works in Windows 7 but it doesn't seem to work this way on all boards.
When this is set to 100%, at idle, your multiplier should not be dropping down below the X3440 default of 19.0, ever. With turbo boost enabled, the minimum multiplier should be 20. That's obviously not happening here.
I'm still not sure if this is a Windows bug or maybe a bios bug. On some computers something has changed but I'm not sure what. Your computer has gone green and thinks everyone should be saving some power.
Tell me about it. :0
I did some more testing and found out that it must be some thermal issue because when I reverted to a smaller overclock (3.4GHz) with more Vcore, it throttled when the temperatures reached over 70 degrees.
I emailed ASRock about this but I doubt I'll get a response.
So would this more likely be a board issue than something with the CPU? If so, I can just buy another brand.
I don't believe this is a CPU issue. Try to find someone else running an X3440 on a different board and see if their CPU throttles down at idle or if the multiplier stays at 19 or 20. Check what OS they are using too. I think what you are seeing is a board / bios issue.
I've been playing around with an E8600 and have some issues here.

The sensors don't seem to do a thing at idleAnything that can be done here to report idle temps?
ASUS P5E X38 (RF 0701 Bios) Q9550@3.51 1.248v, Xigmatek S1283, 8GB GSkill DDR2-8000@990 1.94v, XFX HD5870,
2 - Seagate 7200.10 320G RAID0, Seagate 7200.11 500G, Seagate 7200.12 1.5TB
Lian-Li (Rocketfish) Full Tower, Silverstone Zeus 750Watt, Vista Ultimate x64 SP1, Dell U2410


 Reply With Quote


Bookmarks